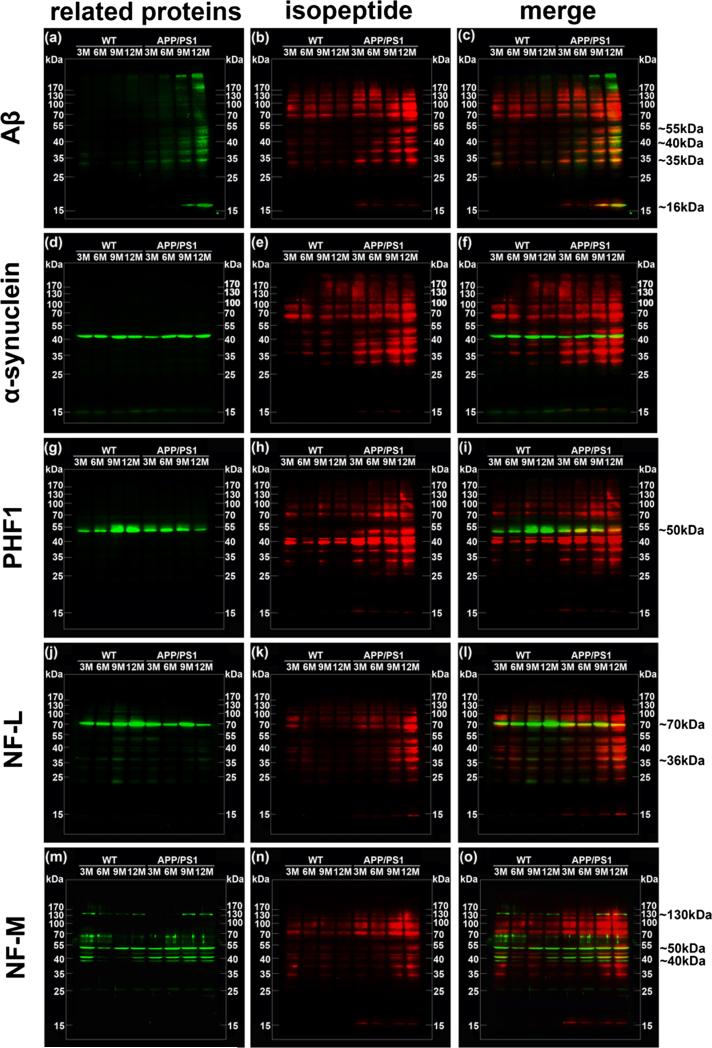
Fig. 7.
Isopeptide overlapping with relative protein in APP/PS1 and WT mice brains. Overlapping of isopeptide and related proteins by immunoblotting detection. Pseudo-color technology was applied to show overlaps of different protein bands. Isopeptide (red) and each related proteins (green) were detected on the same membrane. The bands of Aβ (a), α-synuclein (d), PHF1 (g), NF-L (j), and NF-M (m) were merged with isopeptide bands (b, e, h, k, n) to show overlaps (yellow) (c, f, i, l, o), respectively. The figure is the representative bands to show. Right line represents approximate molecular weight of main overlaps

