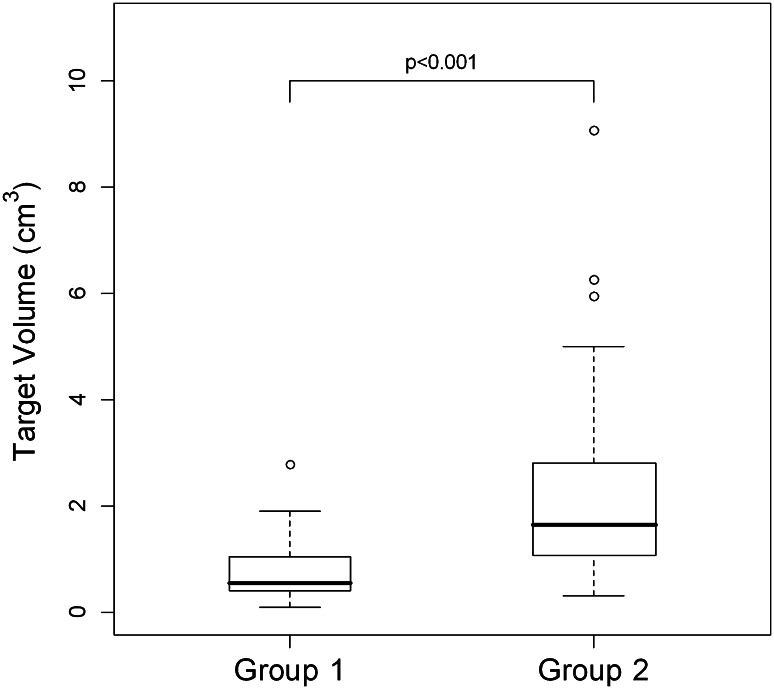
Fig. 2.
Box-and-whiskers plots comparing target volumes. The median target volume for Group 1 (0.54 cm3) was significantly lower than for Group 2 (1.65 cm3). The upper and lower limits of the boxes represent the 75th and 25th percentiles of the data, respectively, with the line in the box representing the median value; whiskers represent data within 1.5 times the interquartile range

