
Figure 3.
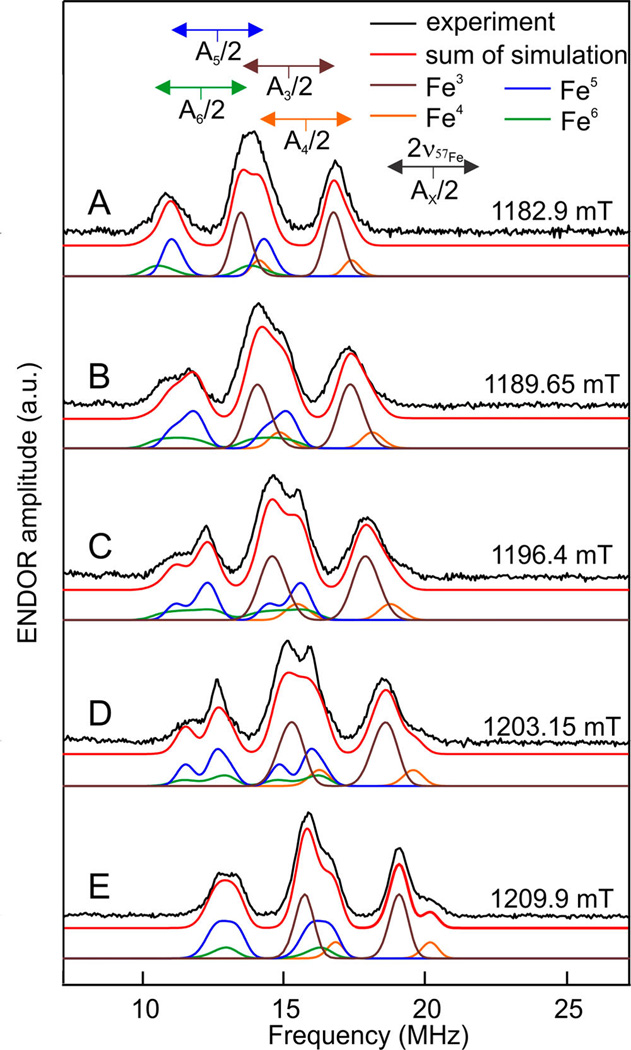
Q-band Davies ENDOR spectra and simulations of Hox-CO HydA1 selectively labeled with 57Fe at the [4Fe-4S]H cluster. Spectra were recorded with an RF pulse of 45 µs, shot repetition time 800 µs, microwave frequency 33.93396 GHz, temperature 20 K at field positions: (A) 1182.9 mT ≈ g1, (B) 1189.65 mT, (C) 1196.4 mT, (D) 1203.15 mT, (E) 1209.9 mT ≈ g2. The black line represents experimental data and the red line the sum of the simulations. The colored lines below each experimental spectrum are the components of the simulation corresponding to the four hyperfine couplings: brown Fe3, orange Fe4, blue Fe5, green Fe6 (see Table S1).