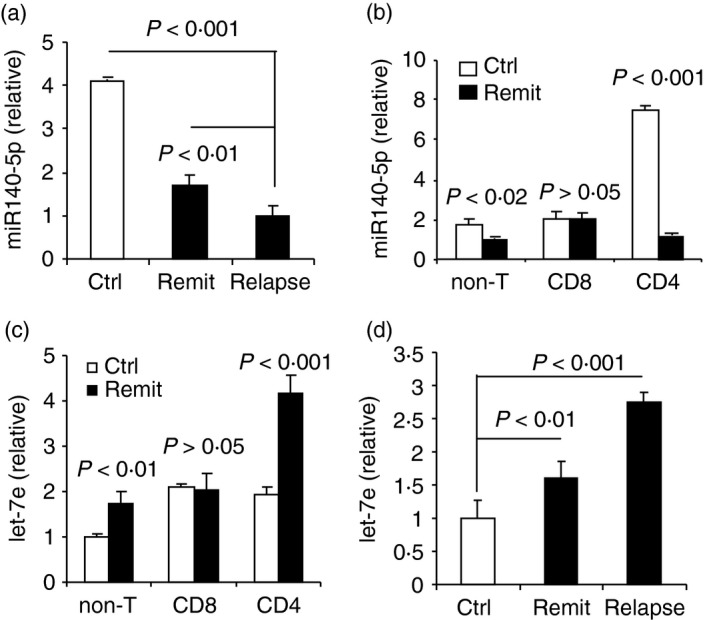
Figure 2.

Down‐regulation of miR‐140‐5p and up‐regulation of let‐7e in patients with multiple sclerosis (MS). (a) Quantitative PCR analysis of miR‐140‐5p in peripheral blood mononuclear cells (PBMCs) of patients with remitting MS (remit), patients with relapsing MS (relapse) and controls (ctrl). (b) Quantitative PCR analysis of miR‐140‐5p in CD4+ T cells, CD8+ T cells and non‐T cells from PBMCs of patients with remitting MS and controls. (c) Quantitative PCR analysis of let‐7e in CD4+ T cells, CD8+ T cells and non‐T cells from PBMCs of patients with remitting MS and controls. (d) Quantitative PCR analysis of let‐7e in PBMCs of patients with remitting MS, patients with relapsing MS and controls. Data are shown as mean ± SEM of seven patients in the remitting stage, seven controls, and four patients in the relapsing stage of MS.
