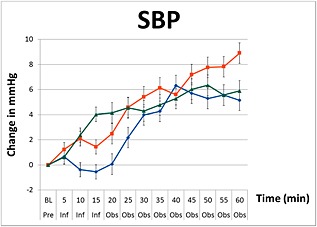
Figure 1.

Changes in systolic blood pressure (SBP) including standard error bars from baseline pre‐infusion (Pre), during a 15 min infusion period (Inf), and 60 min post‐infusion (Obs) of paracetamol ( ), mannitol (
 ) and normal saline (
 ) (repeated measures anova, P < 0.001)
