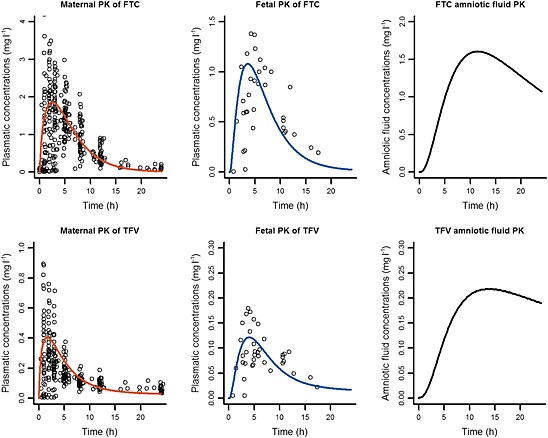
Figure 5.

Simulation vs. observation of administration of emtricitabine (FTC) (top) and tenofovir (TFV) (bottom) during labour. Simulation (lines) of mean maternal (left), fetal (middle) and amniotic fluid (right) pharmacokinetic profile for a single dose compared to observations (points) 5, 6. ‘Time’ represents the delay between the last dose and sampling time
