
Figure 6.
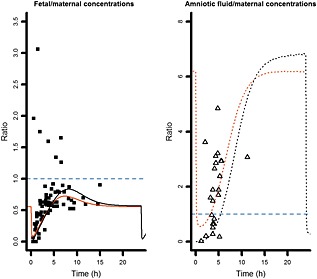
Simulations of fetal‐to‐maternal concentration ratios and amniotic fluid‐to‐maternal concentration ratios for tenofovir, for a single dose and at steady state. Evolution of fetal‐to‐maternal drug concentration ratios (solid lines) and amniotic fluid‐to‐maternal concentration ratios (dashed lines) for a single dose (black bold lines) and at steady state (thin orange lines). Ratios were compared to the available observed data: fetal‐to‐maternal drug concentration ratios (solid squares) and amniotic fluid‐to‐maternal concentration ratios (triangles) obtained by Mirochnick et al. 4