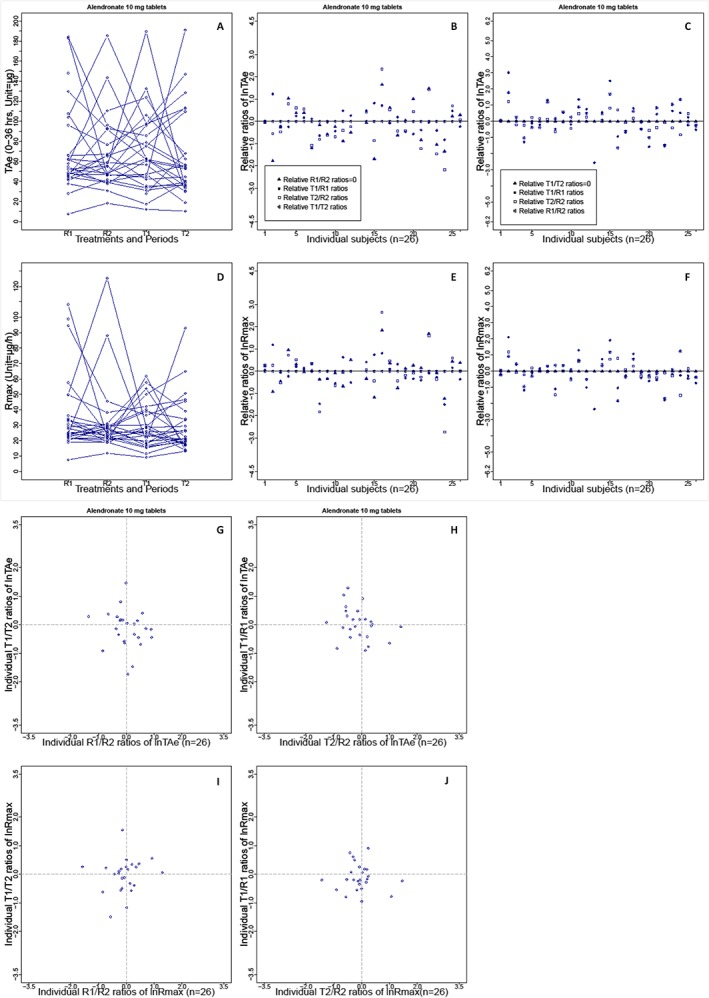
Figure 2.

Intrasubject variability in the total amount of unchanged active substance excreted in the urine (TAe) and the maximum rate of drug excretion (Rmax) seen with brand‐name and generic formulations of alendronate (10 mg) in a replicate design bioequivalence study (n = 26). (A) Distribution of TAe in the trial population after administration of the brand‐name or generic formulation of alendronate (R1, R2, T1 or T2); lines indicate the TAe levels per subject. (B) Difference plots for the ln‐transformed treatment ratios for TAe (T1 : R1, T2 : R2 and T1 : T2), corrected by the brand‐name drug ratios (R1 : R2) in individuals. (C) Difference plots for the ratios corrected by the generic drug ratios (T1 : T2). (G) Correlation of the generic ratios (y‐axis) and the brand‐name ratios (x‐axis) for TAe on a logarithmic scale. (H) Correlation of generic : brand‐name ratios (T1 : R1 and T2 : R2) after the first and second drug administration. (D, E, F, I and J) Graphs of Rmax in the same sequence for TAe. Intrasubject variability based on the other eight bioequivalence studies is shown in Supplementary Figures S1–3
