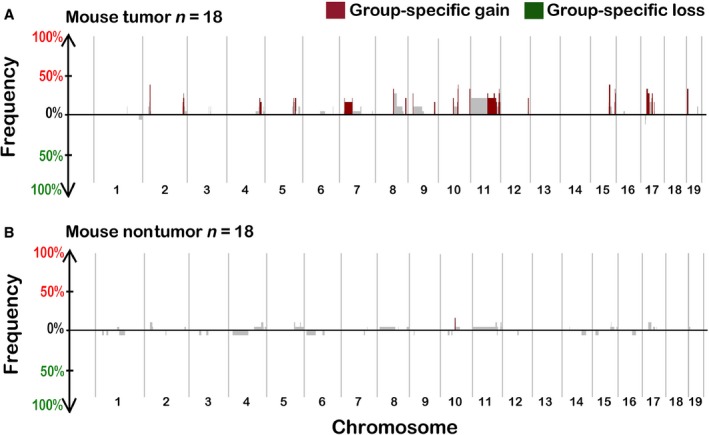
Figure 1.

SWITCHplus plots of mouse tumor (A) and matched nontumor fibrotic liver samples (B). The above plots show the frequency of regions with copy number alterations (CNAs) among the sample set of 18 mice, plotted in genomic order. CNAs were more frequent in tumors (top panel) than in samples from matched fibrotic liver tissue. Regions that are significantly different between the two types of tissue and also appear at a frequency of at least 15% are highlighted.
