Figure 2.

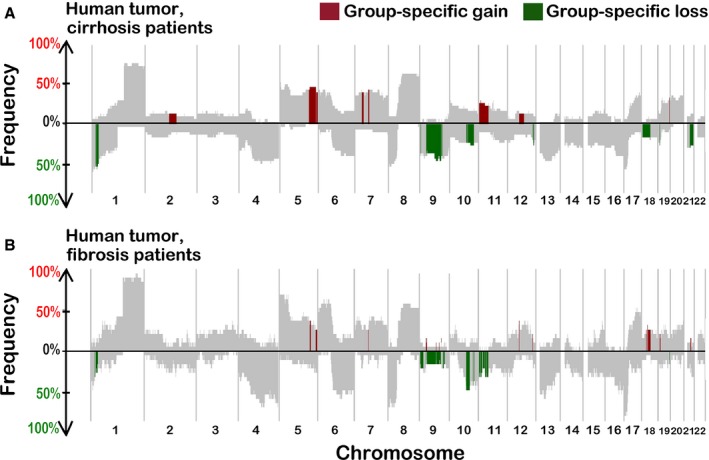
SWITCHplus plots of liver tumors from HCC patients with cirrhosis (A) or fibrosis (B). Regions that are significantly different between the two groups and also appear at a frequency of at least 15% are highlighted.

SWITCHplus plots of liver tumors from HCC patients with cirrhosis (A) or fibrosis (B). Regions that are significantly different between the two groups and also appear at a frequency of at least 15% are highlighted.