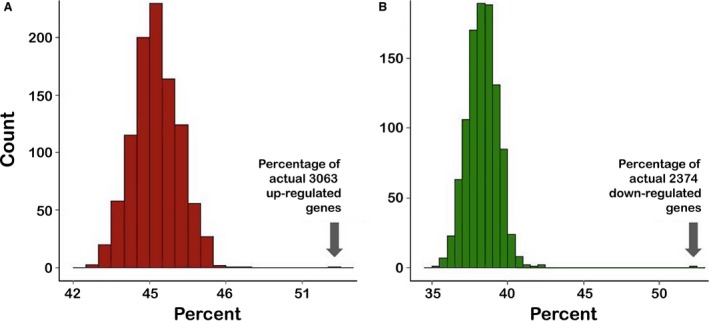
Figure 5.

Histograms of the percentage of genes that are present in segments of copy number gain (A) or loss (B) over 1000 permutations of all of the genes expressed in the human HCC patients. The randomly permuted gene set sizes were 3063 and 2374, which are the true numbers of significantly up‐ and down‐regulated genes, respectively. Arrows highlight the percentage of differentially expressed (FDR‐corrected P‐value < 0.10.) genes that are also within copy number alterations segments in the concordant direction.
