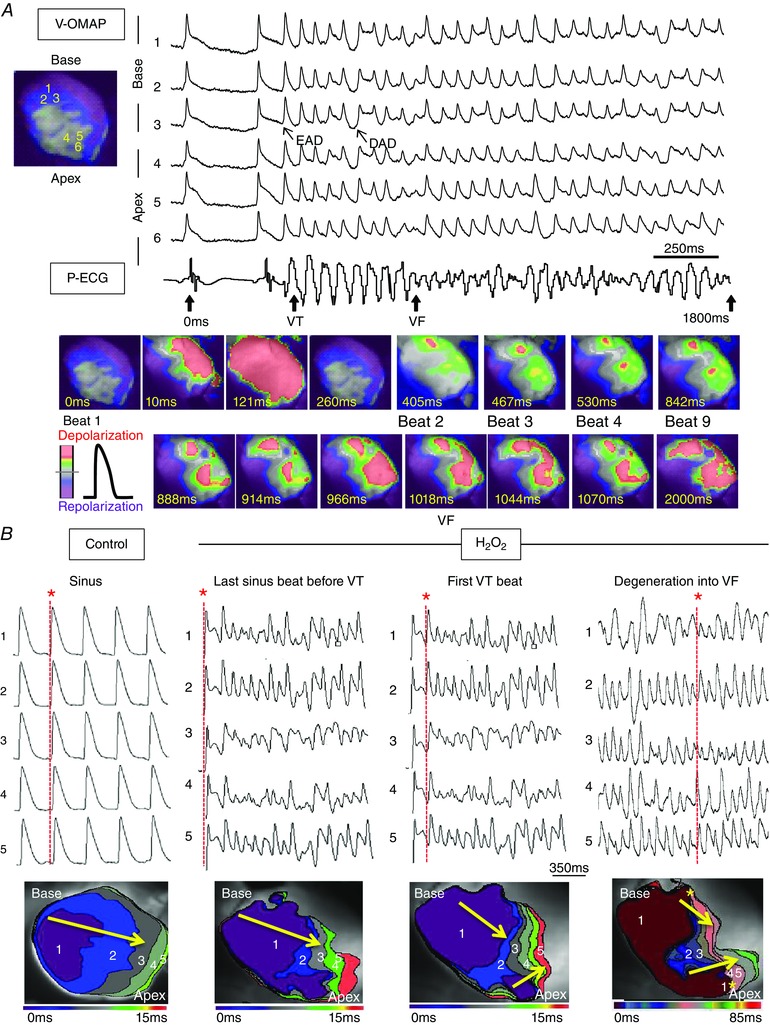
Figure 2. Degeneration of EAD‐mediated focal VT into VF in SHR hearts exposed to H2O2 .

A, voltage epifluorescence optical mapping (V‐OMAP) from the LV base (AP traces 1–3) and apex (AP traces 4–6) of a representative SHR heart exposed to H2O2 with simultaneous P‐ECG recording (bottom trace) captured the onset of a spontaneous focal 8‐beat VT episode arising from prior baseline sinus rhythm. The initial five VT beats were initiated by late phase 3 EADs (APs 1–3) at the base of heart. The subsequent two VT beats (6 and 7) were DAD‐mediated triggered beats, whereas the very last VT beat (8) was another EAD‐mediated triggered beat. After this initial eight rapid triggered beats, the activation pattern degenerated into VF with multifocal irregular wavelets. The snapshots (bottom) illustrate the onset of VT and degeneration of VT into VF. B, isochronal activation maps (lower row) were constructed for selected beats (red * and red dashed lines) from optical APs propagating from base to apex (traces 1–5, upper row) during sinus under control conditions prior to H2O2 exposure (panel 1), then during the onset of VT (panels 2–3) and subsequent degeneration of VT into VF (panel 4) following H2O2 exposure. During VT degeneration into VF, base‐to‐apex epicardial activation was prolonged and multiple foci (yellow *) of conduction slowing and heterogeneous wavelengths emerged and collided, predisposing the LV to wavebreak and re‐entry.
