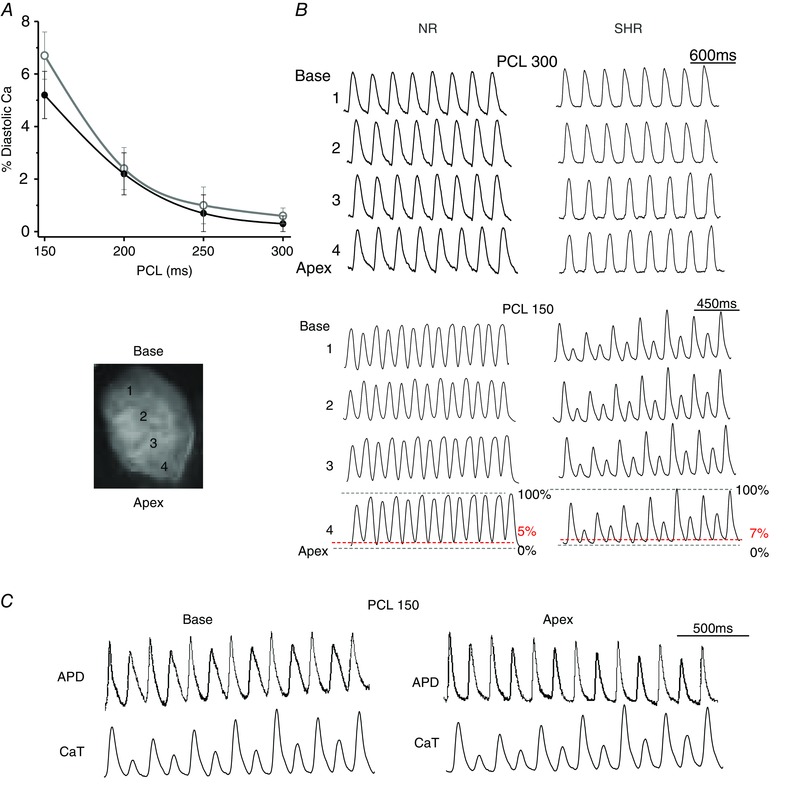
Figure 4. Rate‐dependent CaT alternans in SHR hearts .

A, calcium epifluorescence optical mapping of SHR and NR hearts exposed to H2O2 (n = 5 hearts per group) during four different PCLs of between 300 and 150 ms reveal similar rate‐dependent diastolic calcium level. During PCL of 150 ms, the diastolic calcium amplitude averages 5–7% of the peak CaT in both groups. B, however, only SHR hearts manifest CaT alternans during PCL of 150 ms (bottom right). C, concurrent CaT alternans and APD alternans during PCL of 150 ms in SHR hearts, but not in NR hearts, may facilitate wavebreak and re‐entry.
