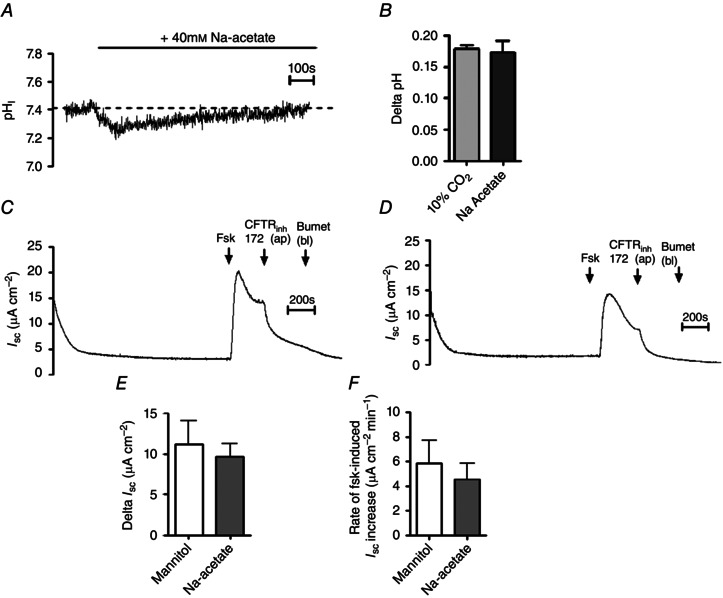
Figure 4. The effect of hypercapnia on cAMP‐dependent transepithelial anion secretion is independent of CO2‐induced intracellular acidosis .

A, a representative experiment in which Calu‐3 cells were gassed with 5% (v/v) CO2/95% (v/v) O2 and exposed to 40 mm sodium acetate and pHi was measured using fluorescence microscopy. B, summary of the magnitude of the intracellular acidosis resulting from either 10% CO2 or sodium acetate. Data represent mean ± SEM; n = 60 for 10% CO2 and n = 6 for sodium acetate. C and D, representative I sc measurements in which cells were exposed to 80 mm mannitol or 40 mm sodium acetate, respectively, for 20 min prior to addition of forskolin (Fsk; 5 μm), apical CFTRinh‐172 (20 μm) and basolateral bumetanide (Bumet; 25 μm) as indicated. E and F, summary of the effect of sodium acetate on the magnitude and the rate, respectively, of the forskolin‐stimulated increase in I sc. Data represent mean ± SEM, n = 5 for each.
