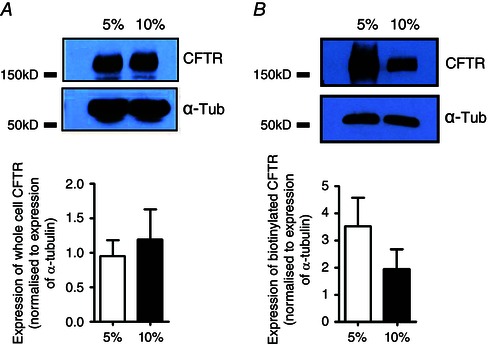
Figure 5. Cell surface expression of CFTR is unaffected by acute hypercapnia .

Calu‐3 cells were grown on permeable transwell supports and membrane expression of CFTR was assessed using a biotinylation assay. A, an example blot of whole cell CFTR expression under 5% CO2 and 10% CO2 and the relative expression of whole cell CFTR when normalised to expression of whole cell α‐tubulin. Data represent mean ± SEM; n = 5. B, an example blot of biotinylated CFTR expression, used as a marker of surface expression, under 5% CO2 and 10% CO2 and the relative expression of biotinlayed CFTR when normalised to expression of biotinylated α‐tubulin. Data represent mean ± SEM; n = 4.
