
Figure 2.
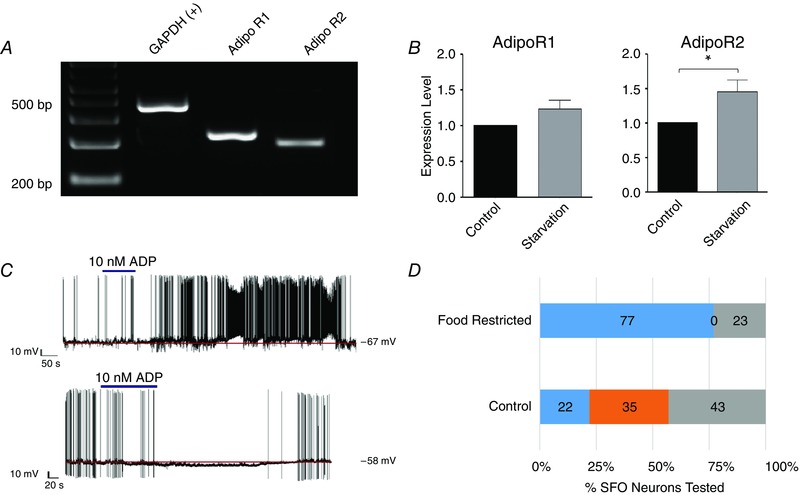
The process of adiponectin receptor validation (Alim et al. 2010) following our identification of these receptors in SFO
A shows an agarose gel from RT‐PCR analysis of whole tissue from SFO using primer sets for GAPDH, AdipoR1 and AdipoR2, all of which were seen to be clearly expressed in the SFO. B, the histograms show qRT‐PCR data confirming microarray analysis indicating that while AdipoR2 was significantly increased by 48 h of food restriction (*), AdipoR1 was not. C, patch clamp recordings from SFO neurons also validate functional roles for these receptors in that proportions of these cells are either depolarized or hyperpolarized by bath administration of adiponectin (ADP, 10 nm, indicated by the bar). D, the histogram summarizes proportions of dissociated SFO neurons from control and food deprived (48 h) groups showing depolarizations (blue bars) or hyperpolarizations (orange bars) in response to adiponectin and illustrate a large shift toward depolarizing effects in the latter group.