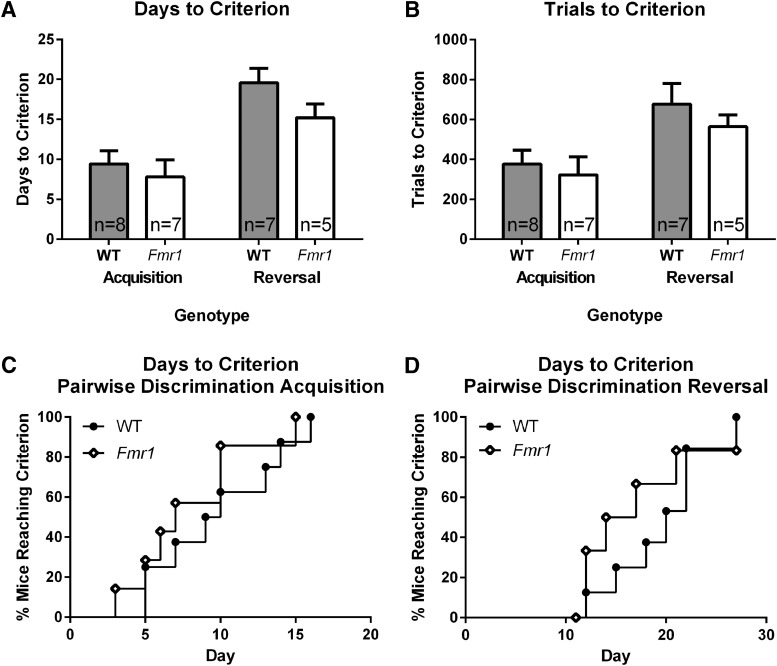
Figure 2.
Pairwise visual discrimination showed no genotype differences in performance between Fmr1 and WT mice. A, Days to criterion for acquisition and reversal of mice completing both phases. B, Trials to criterion for acquisition and reversal of mice completing both phases. C, Days to criterion for acquisition, indicating proportion of individuals that had completed training at each day (survival curve). D, Days to criterion for reversal, indicating the proportion of individuals that had completed reversal at each training day (survival curve).

