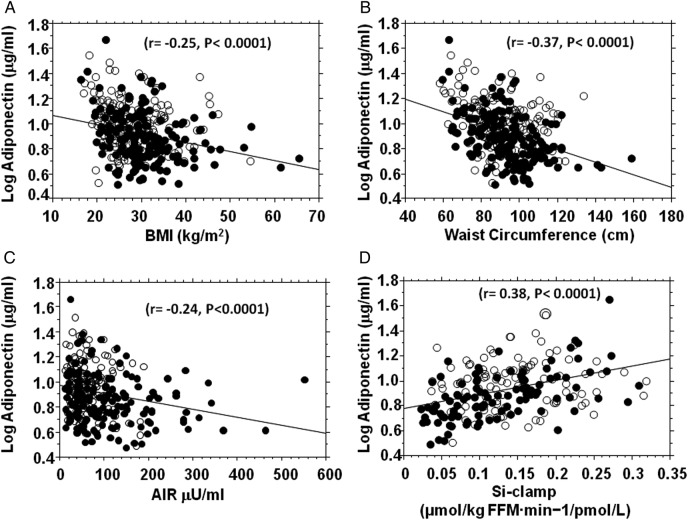
Figure 1.
Fasting plasma adiponectin concentration in relation to body mass index (BMI) (A), waist circumference (B), acute insulin response (AIR) (C) and insulin sensitivity (Si-clamp) (D) in non-diabetic black (closed circles) and white (open circles) offspring of parents with type 2 diabetes. Acute insulin secretory response was assessed using the frequently sampled intravenous glucose tolerance test (N=300 (163 black, 137 white) and insulin sensitivity was measured by hyperinsulinemic euglycemic clamp (N=203(103 black, 100 white)).

