
Figure 6.
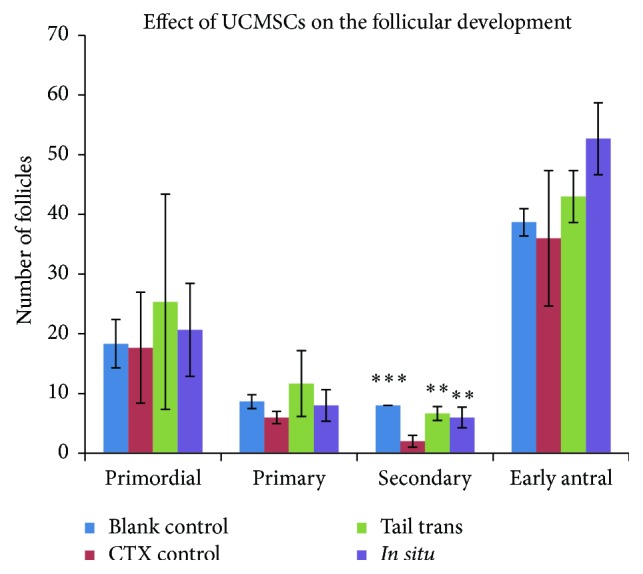
Effect of UCMSCs transplantation on follicular development. Ovarian H&E staining sections were from blank control group, CTX control group, and UCMSCs transplantation groups (by tail intravenously or in situ). Follicles were numbered and classified. Data were means ± SD of counts of different stages follicles in three experiments (secondary follicles of UCMSCs treatment groups versus POF control group: p < 0.01; primordial, primary, and early antral follicles of UCMSCs treatment groups versus POF control group: p > 0.05, n = 3). ∗∗ p < 0.01; ∗∗∗ p < 0.001.