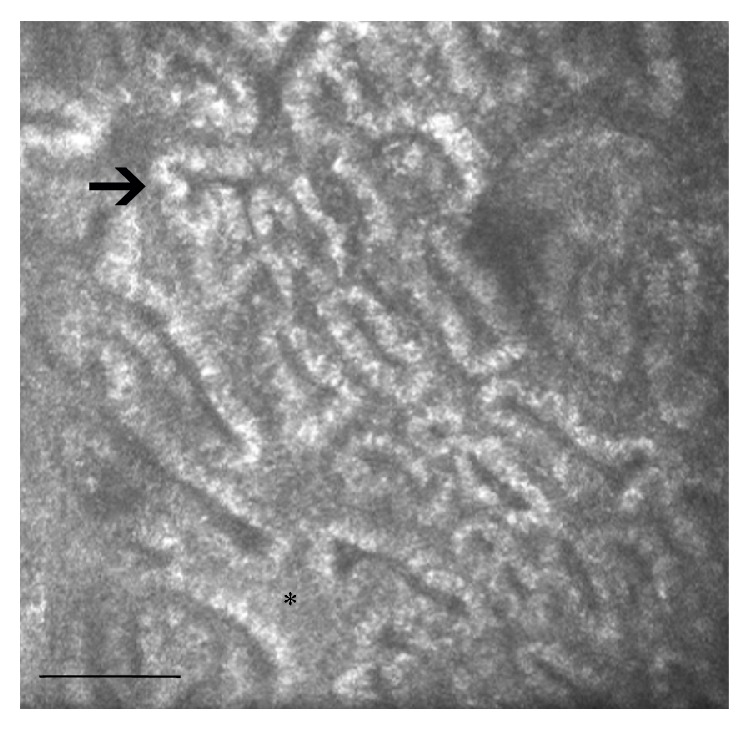
Figure 2.

LSCM of MGs in a contact lens wearer. The most evident modifications are represented by the inhomogeneity of periglandular interstices (asterisk) and MG wall (arrow), periglandular inflammation, and the reduction of MG duct diameters. Bar represents 50 µm.
