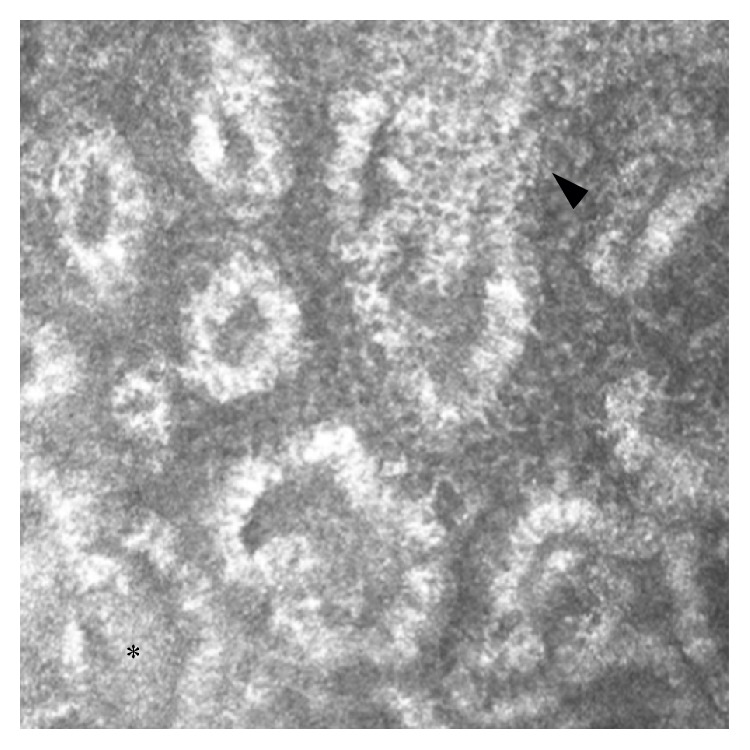
Figure 6.

LSCM of MGs in a glaucomatous patient in multitherapy. The acinar unit density and area appeared to be reduced; MG wall and periglandular interstice presented inhomogeneous appearance, with some scattered hyperreflective punctate elements (arrowhead), and increased density of the meibum (asterisk). Bar represents 50 µm.
