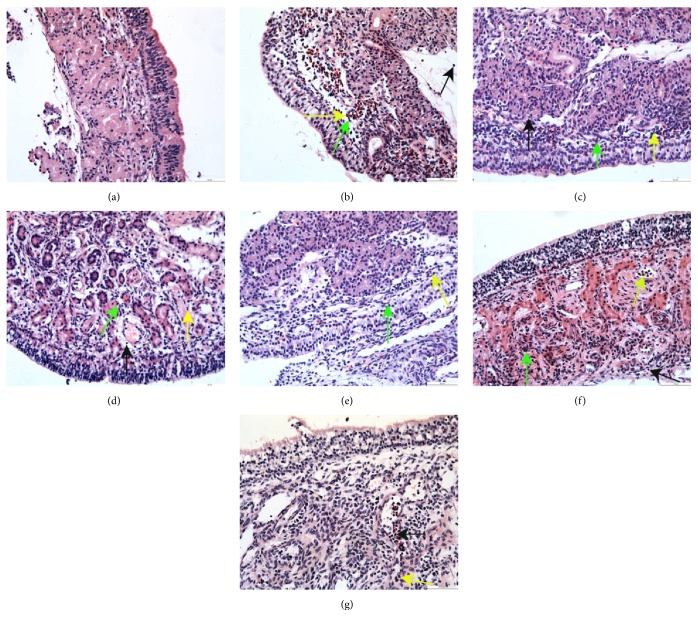
Figure 1.
HE staining of nasal mucosal sections at 8 h in guinea pigs of the healthy control and different treated AR groups (200x). (a) The healthy control group (group C); (b) the AR model group (group M); (c) the 0.1% nonspecific IgY-treated group (group Z1); (d) the 0.1% anti-TNF-α-treated group (group Z2); (e) the 0.1% anti-IL-1β-treated group (group Z3); (f) the 0.1% anti-IL-1β/TNF-α-treated group (group Z4); and (g) the fluticasone propionate-treated group (group Z5). Eosinophils infiltration (the green arrows); neutrophils infiltration (the yellow arrows); lymphocytes infiltration (the black arrows).

