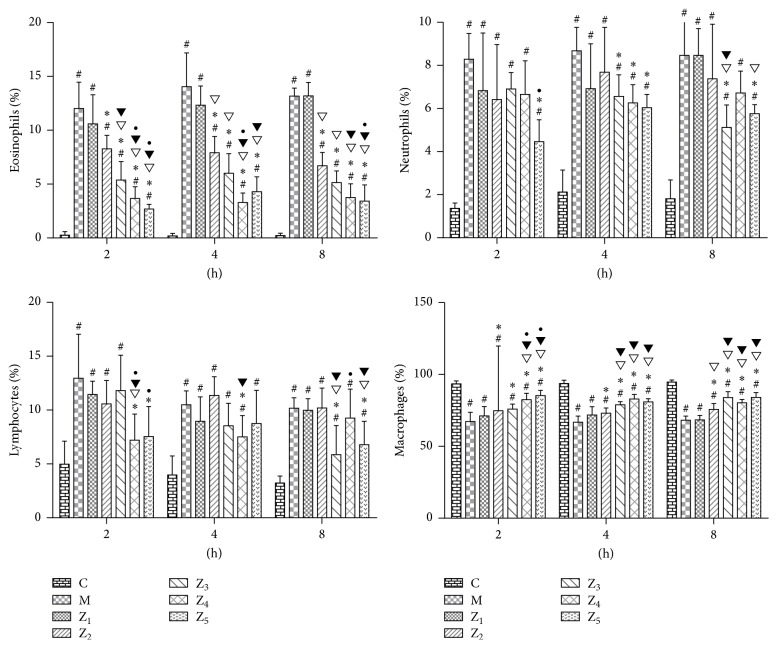
Figure 5.
Percentage of different inflammatory cells (X ± S %) in the NLF in guinea pigs of the healthy control and the different treated AR groups. C, the healthy control group (group C); M, the AR model group (group M); Z1, the 0.1% nonspecific IgY-treated group (group Z1); Z2, the 0.1% anti-TNF-α-treated group (group Z2); Z3, the 0.1% anti-IL-1β-treated group (group Z3); Z4, the 0.1% anti-IL-1β/TNF-α-treated group (group Z4); and Z5, the fluticasone propionate-treated group (group Z5); n = 3~6 per group; #: P < 0.05 compared with the healthy control group (group C); ∗: P < 0.05 compared with the AR model group (group M); ▽: P < 0.05 compared with the 0.1% nonspecific IgY-treated group (group Z1); ▼: P < 0.05 compared with the 0.1% anti-TNF-α-treated group (group Z2); •: P < 0.05 compared with the 0.1% anti-IL-1β-treated group (group Z3).

