
Figure 4.
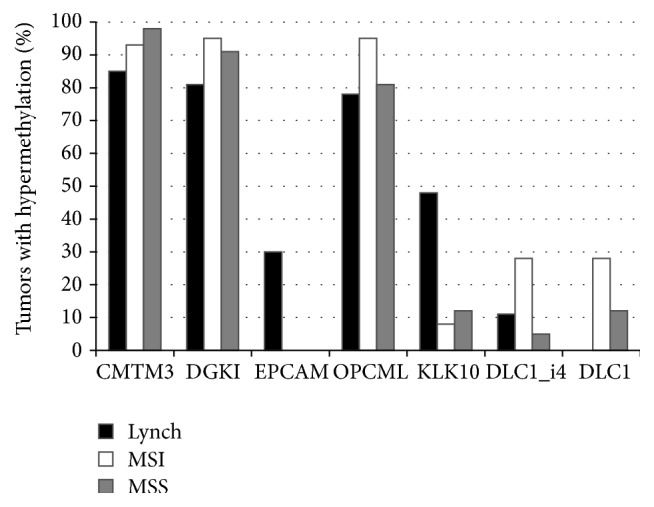
Frequency of promoter hypermethylation for all selected genes in the three categories of tumors. y-axis indicates the percentage of tumors showing hypermethylation, based on cut-off values given in Supplementary Table S4.
Official websites use .gov
A
.gov website belongs to an official
government organization in the United States.
Secure .gov websites use HTTPS
A lock (
) or https:// means you've safely
connected to the .gov website. Share sensitive
information only on official, secure websites.
Frequency of promoter hypermethylation for all selected genes in the three categories of tumors. y-axis indicates the percentage of tumors showing hypermethylation, based on cut-off values given in Supplementary Table S4.