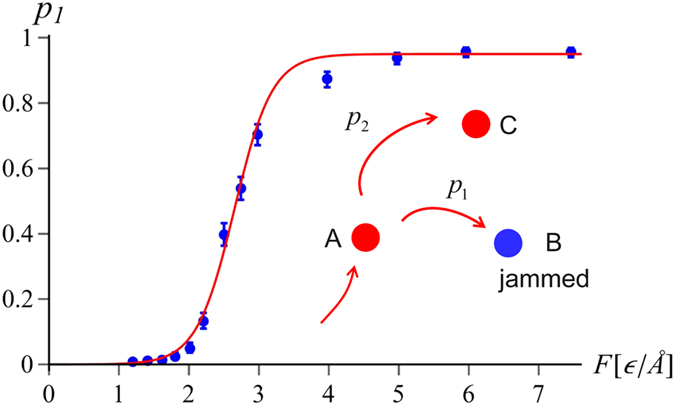
Figure 4. Jamming probability as a function of force for the protein 2k0a pulled by the N terminus.

The data points in this and other figures have been obtained based on the average over 100 simulations runs. The red line represents the fit to the two-pathway model (1) with  ,
,  and
and  . The inset shows schematically the kinetic partitioning between the translocation
  and knot tightening
  . Error bars mark 68% Wilson confidence intervals73.
