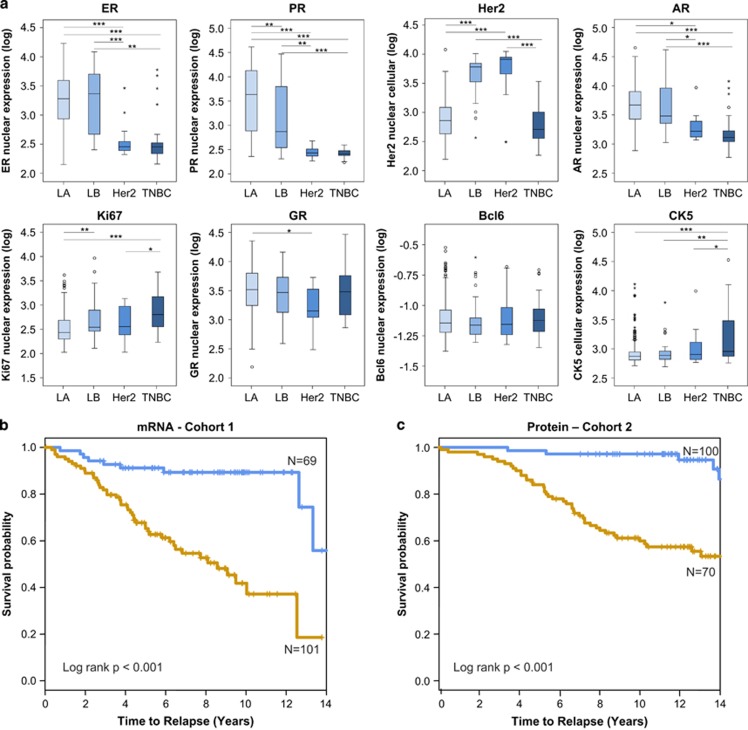
Figure 7.
CK5 and BCL6 expression is associated with poor outcome in ERα+ breast cancer. (a) Box plots depicting quantitative immunofluorescence-based levels of ERα, PR, Her2, AR, GR, Ki67, BCL6 and CK5 proteins in Luminal A (n=185), Luminal B (n=26), Her2-overexpressing (n=16) and triple-negative (TNBC; n=21) subtypes (*P<0.05; **P<0.01; ***P<0.001). Kaplan–Meier curves indicating high (brown line) or low (blue line) risk of recurrence based on recursive partitioning analysis of CK5 and BCL6 mRNA (b) or CK5 and BCL6 protein (c).

