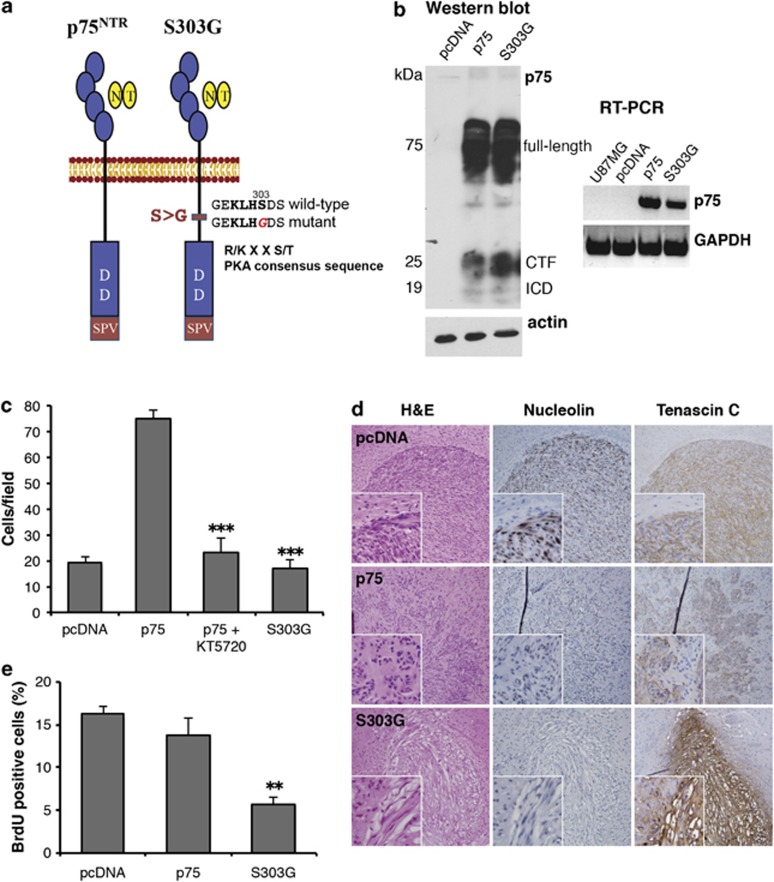
Figure 2.
Mutation of the PKA phosphorylation site (S303G) abrogates p75NTR-mediated invasion in vitro and in vivo. (a) Schematic diagram of wild-type and mutant p75NTR constructs. p75NTR has one putative PKA recognition consensus site (R/K X X S/T; KLHS) within the intracellular domain (ICD) of the protein. A PKA phosphorylation-defective mutant was generated by substitution of amino acid S303 by glycine (S303G). (b) U87MG glioma cells were stably transfected with pcDNA3.1 (pcDNA), pcDNA 3.1 containing wild-type p75NTR (p75) or pcDNA 3.1 containing the S303G mutant of p75NTR. RT–PCR and western blot confirm the expression of the wild-type and mutant receptors. RT–PCR analysis of GAPDH and western blot analysis of actin were included as loading controls. Western blot analysis detected the full-length p75NTR, the 25-kDa C-terminal fragment (CTF) and the 19-kDa ICD of p75NTR. (c) Invasion of S303G cells in collagen-coated transwell chambers was significantly decreased compared with wild-type p75NTR-expressing cells (p75). Noninvasive U87pcDNA were used for comparison. Histogram shows the mean±s.e.m. from three independent experiments; asterisks (***) indicate P<0.001 as compared with non-treated U87p75 (one-way ANOVA with the Neuman-Keuls post-test). (d) pcDNA, p75 and S303G cells (5 × 10⁴ cells) were implanted intracerebrally into SCID mice and allowed to grow for 28 days. The mice were killed, and paraffin brain sections were stained with Hematoxylin & Eosin (H&E) or antibodies against human nucleolin or tenascin-C (brown) to visualize the tumors. Sections were counterstained with hematoxylin (blue). (e) In vivo tumor proliferation was determined by injecting bromodeoxyuridine (BrdU) into tumor-bearing mice 24 h prior to killing of the mice. Frozen brain sections were stained with an antibody against BrdU and counterstained with toluidine blue to visualize the cell nucleus. Cells that had divided during the 24 h prior to killing of the mice stained positively for BrdU, and the percentage of BrdU-positive cells was counted. Histogram represents the percentage of BrdU-positive cells in five consecutive fields. Values shown are the mean±s.e.m. from five independent mice; asterisks (**) indicate P<0.01 as compared with control U87pcDNA (one-way ANOVA with the Neuman-Keuls post-test).

