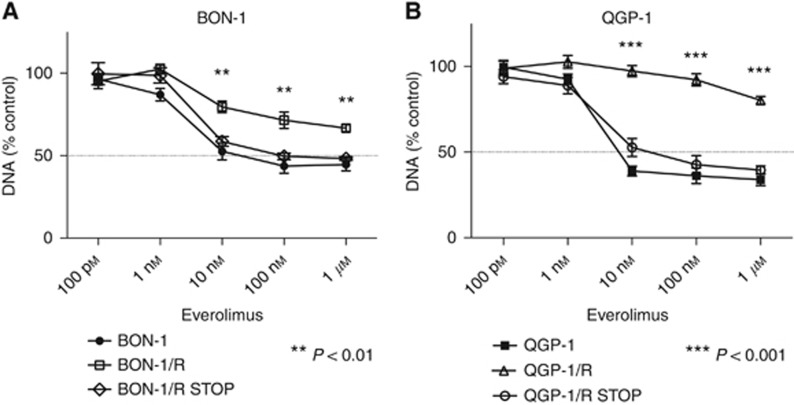
Figure 3.
Everolimus dose response curves after 10 to 12 weeks of wash-out. Response was evaluated after 7 days of treatment with increasing everolimus concentrations in BON-1/R, long-term vehicle-treated BON-1, and BON-1/R after an everolimus wash-out period of 12 weeks (BON-1/R STOP) (A) and QGP-1/R, and in long-term vehicle-treated QGP-1/ and QGP-1/R after an everolimus wash-out period of 10 weeks (QGP-1/R STOP) (B). Growth inhibitory response is expressed as the percentage of vehicle-treated control (±s.e.m.). Control is normalised at 100%. P-values shown are for Dunn Sídák post hoc comparison after two-way ANOVA between BON-1/R and QGP-1/R and BON-1/R STOP and QGP-1/R STOP, respectively.

