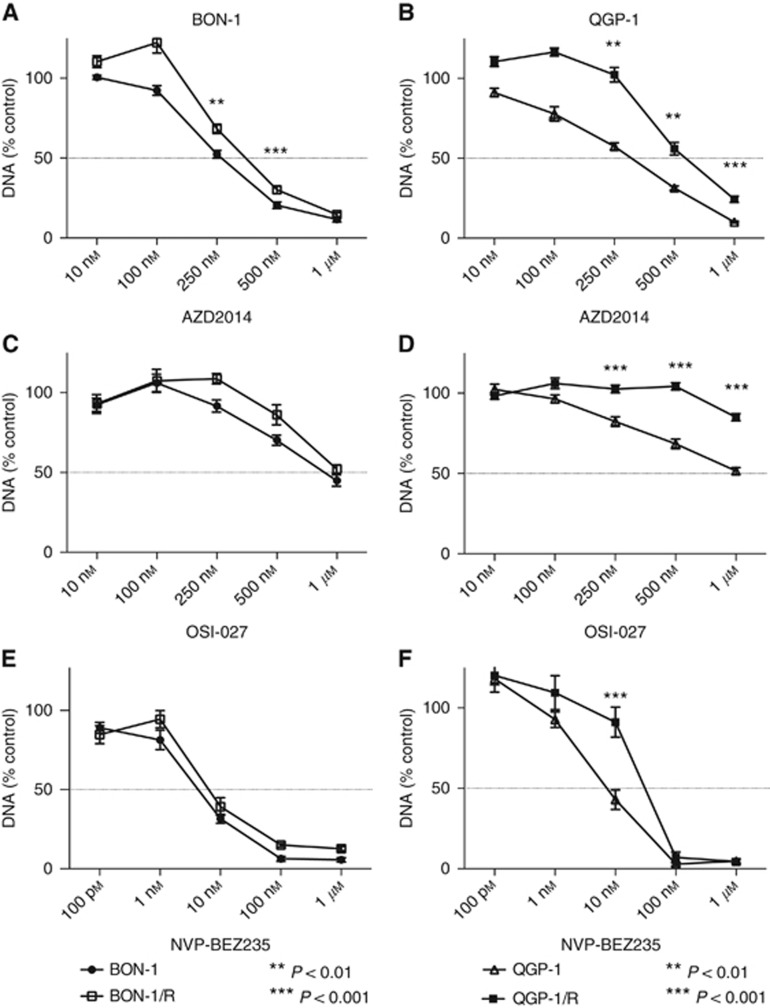
Figure 4.
Dose–response curves with novel PI3K-Akt-mTOR inhibitors in BON-1/R and long-term vehicle-treated BON-1 and QGP-1/R and long-term vehicle-treated QGP-1. Cells were treated during 7 days with, respectively, AZD2014 (A, B), OSI-027 (C, D) and NVP-BEZ235 (E, F). Response is expressed as the percentage of vehicle-treated control (±s.e.m.). Control is normalised at 100%.

