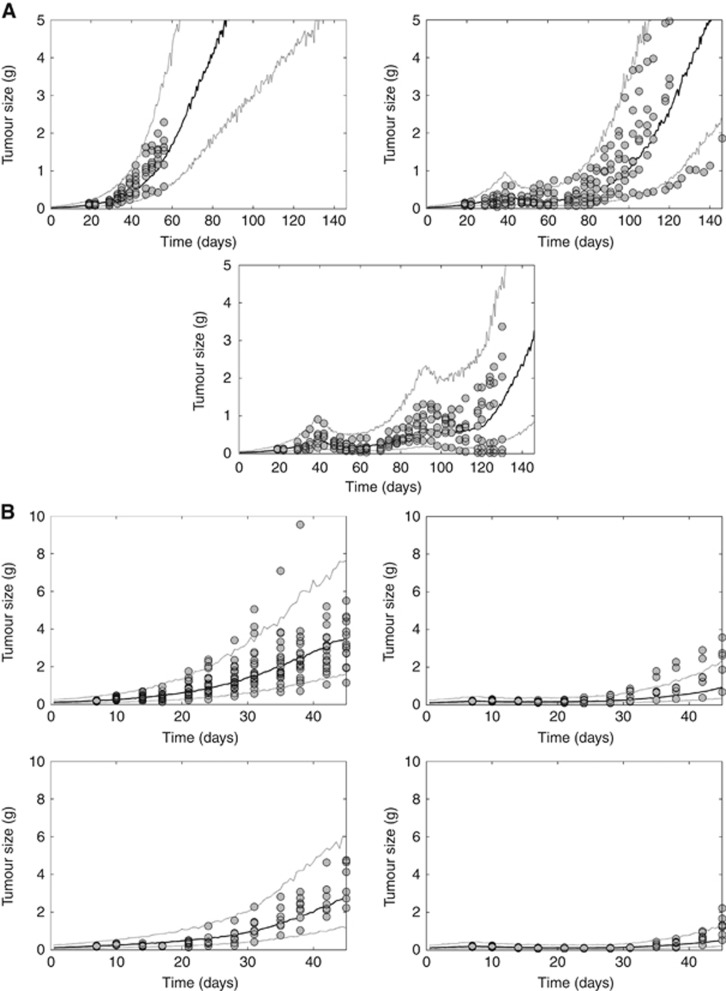
Figure 3.
Visual predictive check of the tumour growth model in A375 xenograft-bearing mice for two studies: (A) after treatment with vehicle (top left) or with vemurafenib 15 mg kg−1 twice a day for 48 days, subsequently continuing with vemurafenib treatment (top right) or switching to 90 mg kg−1 abemaciclib every day for a further 28 days (bottom centre); and (B) after treatment with vehicle (top left) or with vemurafenib 10 mg kg−1 twice a day (top right) or abemaciclib 45 mg kg−1 every day alone (bottom left) or in combination for 21 days (bottom right). The circles denote observed A375 tumour size data. The solid and dotted lines represent the median, and the 5th and 95th percentiles of 1000 individual model simulations, respectively.

