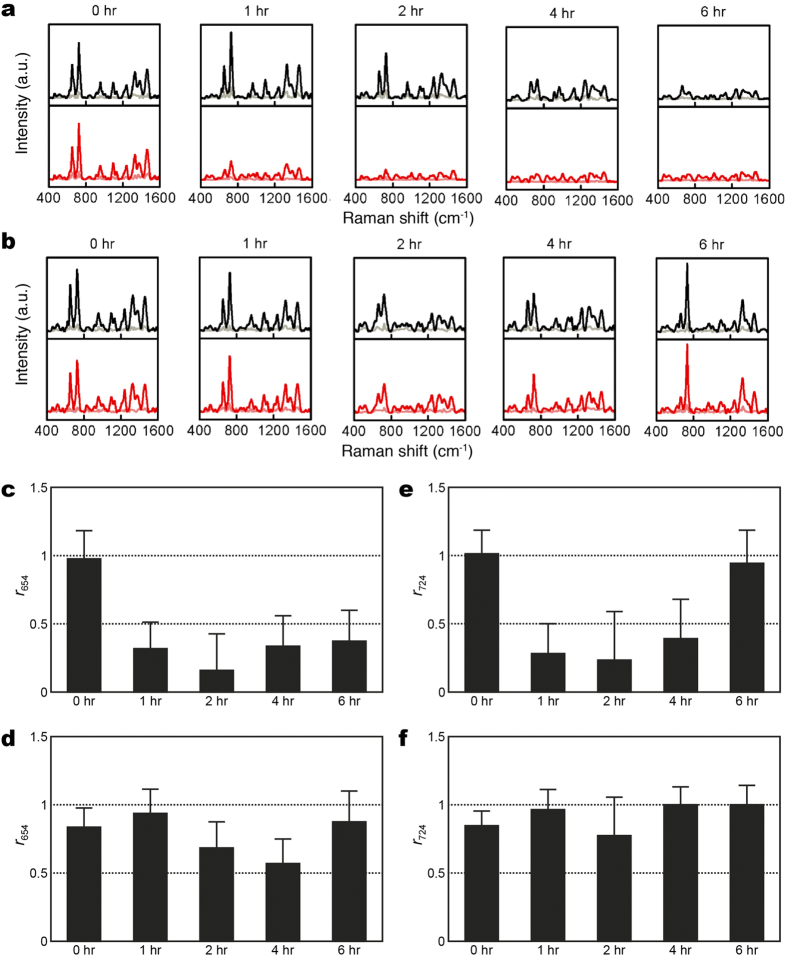
Figure 3. Evolution of SERS spectra for imipenem-susceptible and -resistant E. coli with and without imipenem treatment.
(a) E. coli (ATCC 25922); (b) clinical isolate of imipenem-resistant E. coli with (red curves) and without (black curves) imipenem treatment; (c) signal ratio of 654-cm−1 SERS peak (r654) of E. coli (ATCC 25922) as a function of imipenem treatment time; (d) r654 of imipenem-resistant E. coli as a function of imipenem treatment time; (e) signal ratio of 724-cm−1 SERS peak (r724) of E. coli (ATCC 25922) as a function of imipenem treatment time; (f) r724 of imipenem-resistant E. coli as a function of imipenem treatment time. Black and red curves represent the mean SERS spectra, while gray and light red curves represent their corresponding standard deviation.

