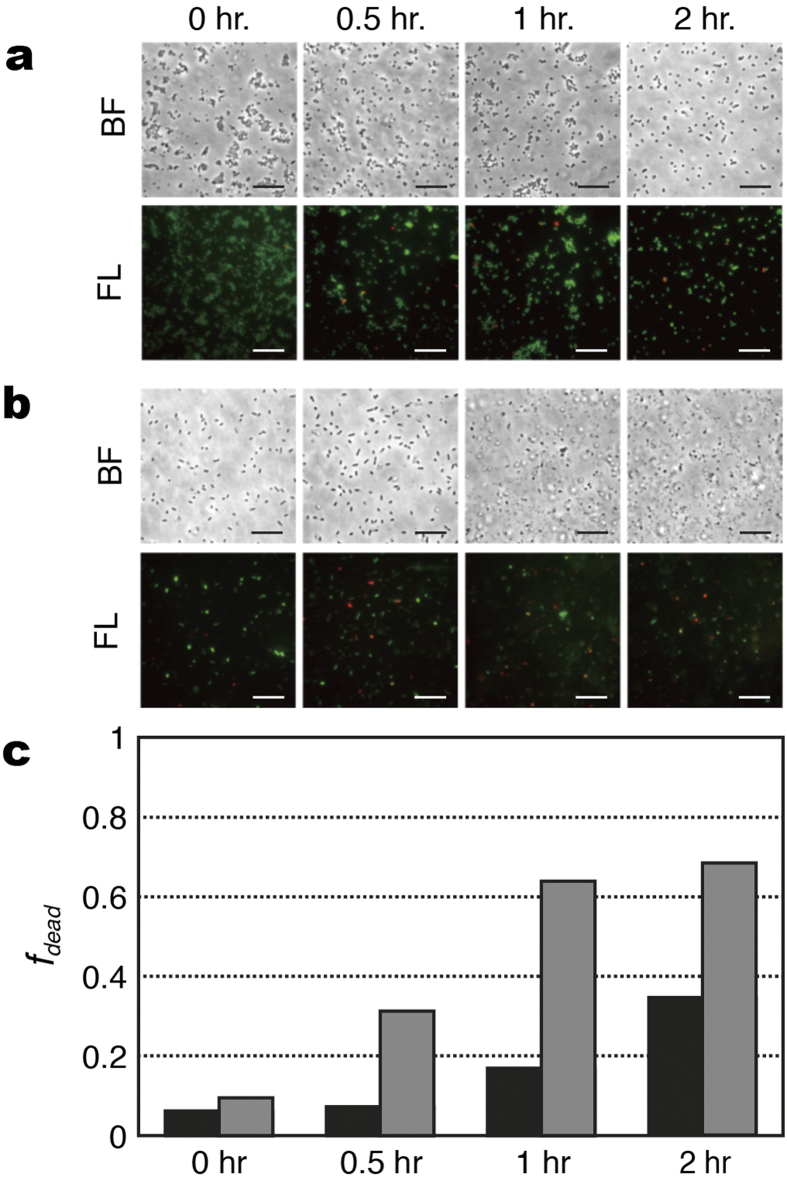
Figure 4. Viability staining tests of Gram-positive and Gram-negative bacteria after antibiotic treatment.
After being treated by antibiotics for 0, 0.5, 1 and 2 hours, the bacteria were stained with PI (fluorescing red) and SYTO 9 (fluorescing green). BF: bright-field image; FL: fluorescence image. (a) S. aureus (ATCC 29213) treated with oxacillin; (b) E. coli (ATCC 25922) treated with imipenem; (c) percentage of dead bacteria (fdead): S. aureus (black columns) and E. coli (gray columns). fdead = Nr/(Ng + Nr − Ng+r), where Nr is the count of the red signatures, Ng is the count of the green signatures, and Ng+r is the count that the green and red signatures overlap. The scale bars represent 20 μm.

