
Figure 5. Evolution of SERS biomarker signal versus antibiotic treatment time for different concentrations of antibiotics.
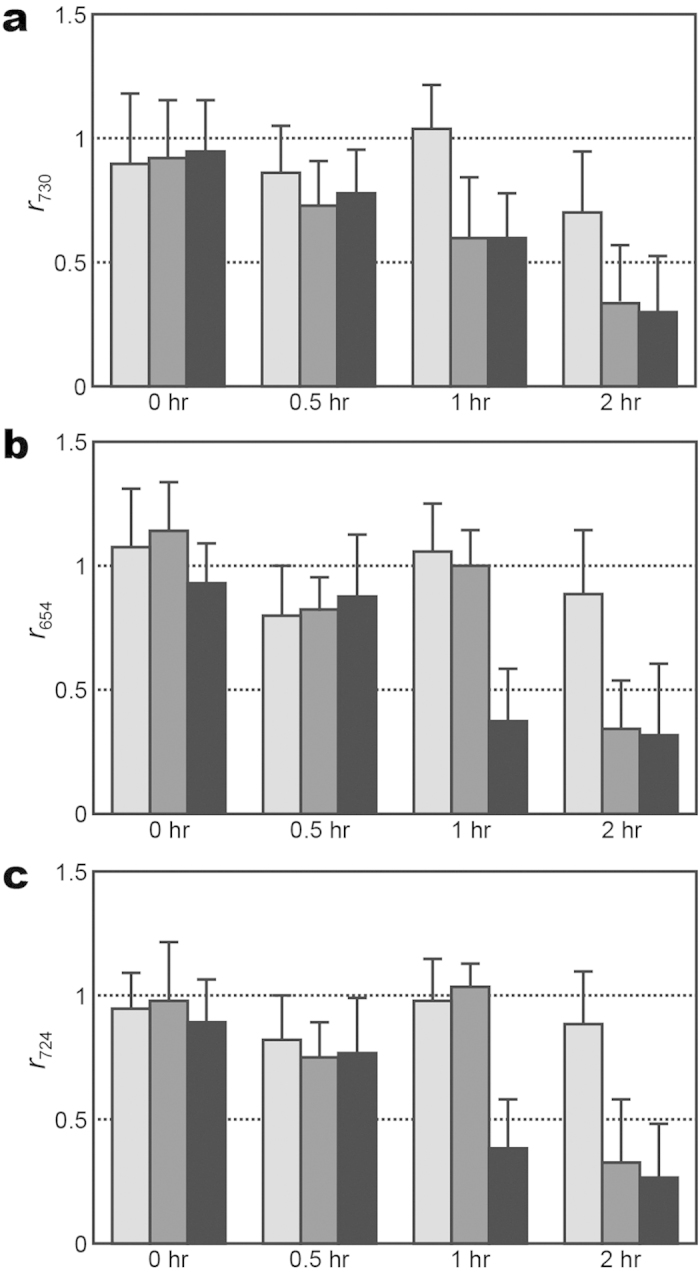
(a) Signal ratio of 730-cm−1 SERS peak (r730) of S. aureus versus vancomycin treatment time at concentrations of 0.5 μg/ml (light gray columns), 1 μg/ml (gray columns), and 2 μg/ml (black columns); (b,c) signal ratios of 654-cm−1 SERS peak (r654) and 724-cm−1 SERS peak (r724) of E. coli, respectively, versus imipenem treatment time at concentrations of 0.03 μg/ml (light gray columns), 0.06 μg/ml (gray columns), and 0.12 μg/ml (black columns).