. 2016 Jan 15;7(3):2371–2380. doi: 10.1039/c5sc02978c

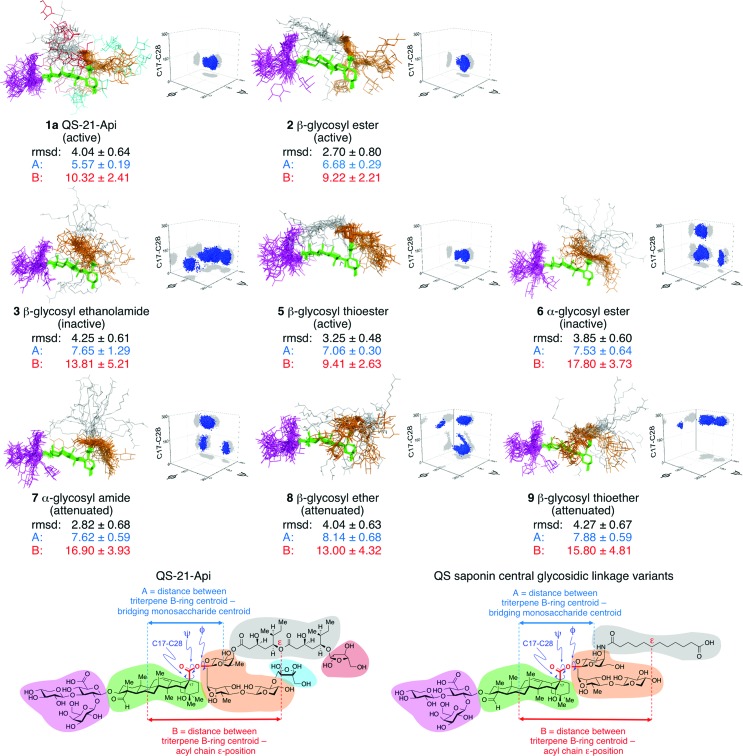
Fig. 3. Ensembles obtained from unrestrained 200 ns molecular dynamics simulations of QS-21-Api (1a) and saponin variants 2, 3, and 5–9. The rmsd (Å) for heavy atoms relative to average structure, key distance constraints (Å), and three-dimensional plots of torsional angle distributions (C17–C28, ψ, φ, arbitrary scale) about the central glycosidic linker are shown. QS saponin structural domains are color-coded: branched trisaccharide (magenta), triterpene (green), linear trisaccharide (orange), acyl chain (gray), terminal sugars (QS-21 only: cyan, red). In the three-dimensional plots, torsional angle distributions are shown in blue and projections onto each plane are shown in gray. Active adjuvants exhibit distinctive and tightly-clustered torsional angle distributions about the central glycosidic linkage and comparatively shorter distances between the centroid of the triterpene B-ring and the centroid of the bridging monosaccharide (A, blue) as well as between the centroid of the triterpene B-ring and the acyl chain ε-position (B, red). See Fig. S4–S8 for additional details.

Fig. 3