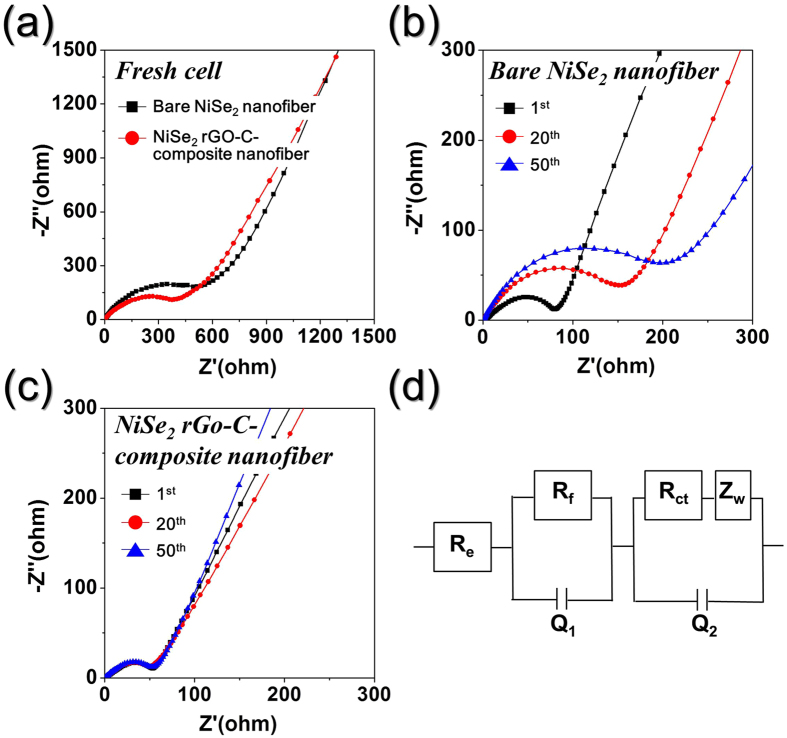
Figure 5. Nyquist impedance plots of the NiSe2-rGO-C composite nanofibers and bare NiSe2 nanofibers.
(a) Nyquist impedance plots of the nanofibers before cycling, (b) Nyquist impedance plots of bare NiSe2 nanofibers after cycling, (c) Nyquist impedance plots of NiSe2-rGO-C composite nanofibers after cycling, and (d) equivalent circuit model used for AC impedance fitting.

