Abstract
Epithelial ovarian cancer (EOC) is the most deadly of the gynecological cancers. New approaches and better tools for monitoring treatment efficacy and disease progression of EOC are required. In this study, metabolomics using rapid resolution liquid chromatography mass spectrometry was applied to a systematic investigation of metabolic changes in response to advanced EOC, surgery and recurrence. The results revealed considerable metabolic differences between groups. Moreover, 37, 30, and 26 metabolites were identified as potential biomarkers for primary, surgical and recurrent EOC, respectively. Primary EOC was characterized by abnormal lipid metabolism and energy disorders. Oxidative stress and surgical efficacy were clear in the post-operative EOC patients. Recurrent EOC patients showed increased amino acid and lipid metabolism compared with primary EOC patients. After cytoreductive surgery, eight metabolites (e.g. l-kynurenine, retinol, hydroxyphenyllactic acid, 2-octenoic acid) corrected towards levels of the control group, and four (e.g. hydroxyphenyllactic acid, 2-octenoic acid) went back again to primary EOC levels after disease relapse. In conclusion, this study delineated metabolic changes in response to advanced EOC, surgery and recurrence, and identified biomarkers that could facilitate both understanding and monitoring of EOC development and progression.
Epithelial ovarian cancer (EOC) continues to be one of the most frequently diagnosed malignancies worldwide, and is the most deadly of the gynecological cancers1. The majority of patients tend to present in advanced stages, and 5-year survival rates are below 30%2. Standard treatment for advanced EOC involves cytoreductive surgery followed by platinum-based chemotherapy3. Despite the favorable response to initial therapy, most patients will relapse within 18 months3. Recurrent EOC usually develops chemotherapy resistance and invariably is fatal4. To improve survival rates, new efforts should be devoted to the discovery of novel biomarkers to monitor disease progression and personalize therapy for advanced EOC patients.
Cancer cells possess a fundamentally altered metabolism that enables tumorigenicity and malignancy5. Our understanding of the biochemical underpinnings of cancer development and progression could lead to the discovery of potential therapeutic targets and the achievement of individualized disease management. Metabolomics, which is defined as the global measurement of endogenous metabolites in a given biological sample, provides comprehensive insights into biological processes6. Over the past decade, metabolomics has been successfully applied to studies of cancer metabolism in various cancers, including ovarian cancer7,8,9,10,11,12,13,14. Our previous plasma and urinary metabolomic studies have identified many potential biomarkers and pathways related to ovarian cancer, which increase understanding of ovarian cancer pathogenesis and could facilitate clinical diagnosis10,11,12,13,14. However, few studies have investigated metabolic alterations associated with responses to EOC treatment and disease relapse.
In this study, four batches of plasma samples were collected from the following patients: 35 pairs of EOC patients at the time of diagnosis (primary EOC patients) and after cytoreductive surgery (post-operative EOC patients), 35 matched controls, and 35 matched recurrent EOC patients. Metabolic profiling of these samples was performed by rapid resolution liquid chromatography mass spectrometry (RRLC/MS). First of all, potential biomarkers were identified for the primary, surgical and recurrent EOC, respectively. Then, metabolic changes of primary EOC biomarkers were monitored in the post-operative and recurrent EOC patients. Our ultimate goals were (1) to investigate metabolic alterations that underlie the responses to advanced EOC, surgical intervention and disease relapse; and (2) to discover potential biomarkers that could monitor EOC surgical efficacy and disease relapse.
Results
Enrolled patient characteristics
Thirty-five plasma samples from primary EOC patients, 35 from the same EOC patients after surgery, 35 from relapsed EOC patients, and 35 from controls were included in this study. The controls were age- and menopause-matched with primary EOC patients, and the recurrent EOC patients were age-, menopause- and stage-matched with primary EOC patients. According to the International Federation of Gynecology and Obstetrics (FIGO) staging system, 31 of the EOC patients were classed as stage III and four as stage IV. All EOC patients enrolled in this study had received cytoreductive surgery followed by platinum-based chemotherapy. There were no statistical differences observed for age, menopause, stage, weight, lymph node status, histology type, and histology differentiation among the four groups (P > 0.05). Detailed clinical characteristics for the participants are listed in Table 1.
Table 1. Clinical characteristics of the participants enrolled in this study.
| Characteristics | Controls (n = 35) | Primary EOC (n = 35) | Post-operative EOC (n = 35) | Relapsed EOC (n = 35) | P value† |
|---|---|---|---|---|---|
| Age (mean ± SD*) | 53.22 ± 8.30 | 53.67 ± 9.04 | 53.76 ± 9.05 | 54.31 ± 7.28 | 0.9616a |
| Weight (median/range) | 60 (45 ~ 87) | 60 (50 ~ 91.5) | 63.50 (44 ~ 88) | 0.1359b | |
| Menopause (pre/post) | 11/24 | 11/24 | 11/24 | 1.0000c | |
| CA125(median/range) | 17.45 (5.06 ~ 184.5) | 490.80 (67.23 ~ 5000.00)‡ | 95.10 (21.06 ~ 2048.00) | <0.0001b | |
| FIGO Stage (III/IV) | – | 31/4 | 31/4 | 1.0000c | |
| Lymph node metastasis (Yes/No) | – | 20/15 | 17/18 | 0.4726c | |
| Histology differentiation | 0.7936c | ||||
| Well | – | 5 | 4 | ||
| Moderately | – | 11 | 14 | ||
| Poorly | – | 19 | 17 | ||
| Histology type | 0.7022c | ||||
| Serous | – | 27 | 25 | ||
| Mucoid | – | 3 | 2 | ||
| Endometrioid | – | 5 | 8 | ||
*SD: standard deviation.
†P value refers to the statistical significance of differences among or between groups: aOne-way analysis of variance was performed. bNonparametric Kruskal-Wallis rank sum test was performed. cChi-square (χ2) test or Fisher’s exact test was performed.
‡The CA125 value is measured as the pre-operative value.
Metabolic profiles of primary EOC patients vs. matched controls
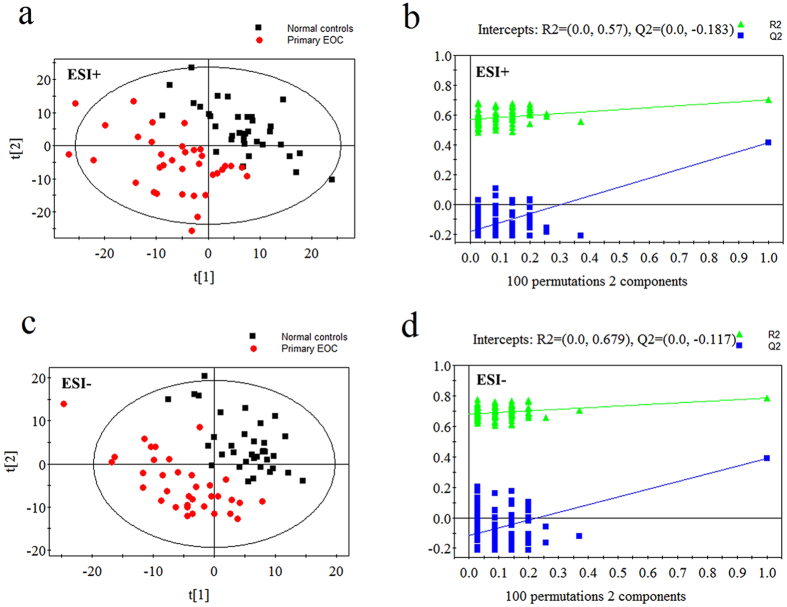
Typical chromatograms of our plasma samples are shown in Supplementary Fig. S1. The final data set consisted of 1924 ions (peaks) in ESI+ mode and 1428 in ESI- mode. The PCA performed on all the samples revealed that the QC samples were tightly clustered in PCA score plots, indicating the robustness of our metabolic profiling platform15. Because of the high complexity and variance in the data, the unsupervised method PCA could not detect obvious separations among the four groups (see Supplementary Fig. S2). The supervised method PLS-DA was performed, and prediction models were established. As shown in the PLS-DA score plots, the plasma samples from primary EOC patients and well-matched controls were clearly separated into two categories (Fig. 1a,c). The validation plots from permutation tests strongly supported the validity of the established PLS-DA models(Fig. 1b,d). Validity was supported by the result that all permuted R2 and Q2 values on the left were lower than the original point on the right, and that the Q2 regression line in blue had a negative intercept16. With the criteria of VIP >1 and P < 0.05, 37 metabolites were identified as potential biomarkers for primary EOC. Detailed information of metabolite identification can be referred to Supplementary Figs S3–S8. In the primary EOC patients, these markers included elevated l-kynurenine, hypoxanthine, and hydroxyphenyllactic acid, and decreased lysophosphatidylcholines (LPCs), fatty acids, amino acids, and bile acids. The metabolites, including biochemical characteristics, statistical information and metabolic pathways, are detailed in Supplementary Table S1.
Figure 1. PLS-DA score plots and validation plots for primary EOC patients versus controls.
(a) PLS-DA score plot in ESI+ mode (two components, R2 = 0.704, Q2 = 0.412); (b) validation plot in ESI+ mode; (c) PLS-DA score plot in ESI− mode (two components, R2 = 0.785, Q2 = 0.388); (d) validation plot in ESI− mode.
Metabolic profiles of pre- and post-operative EOC patients
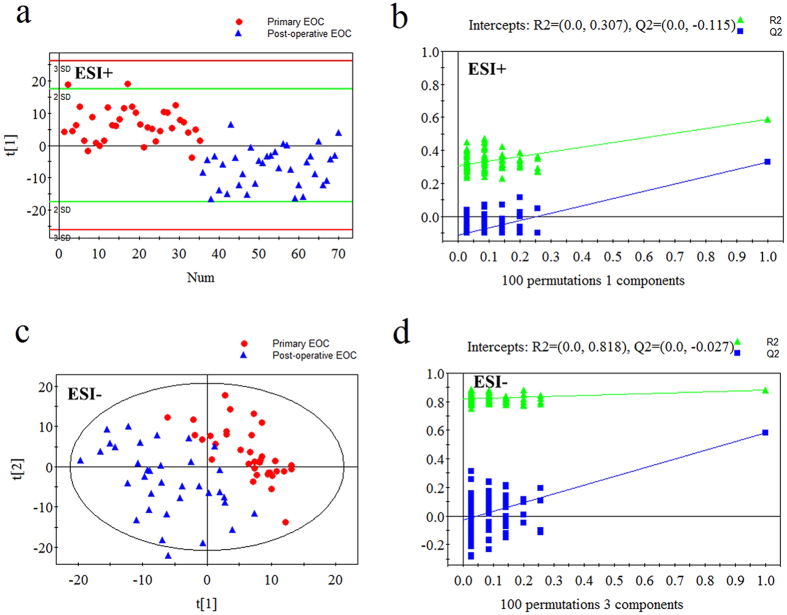
The PLS-DA score plots revealed excellent classifications between primary and post-operative EOC patients (Fig. 2a,c). The validation tests supported the validity of the PLS-DA models (Fig. 2b,d). Altogether, 30 metabolites were important in the sample classification, as indicated by VIP >1 and P < 0.05. Post-operative EOC patients were characterized by increased fatty acids, amino acids, and uric acid, and decreased LPCs, l-kynurenine, and indoxylsulfuric acid (see Supplementary Table S2).
Figure 2. PLS-DA score plots and validation plots for primary EOC patients versus post-operative EOC patients.
(a) PLS-DA score plot in ESI+ mode (one components, R2 = 0.588, Q2 = 0.327); (b) validation plot in ESI+ mode; (c) PLS-DA score plot in ESI− mode (three components, R2 = 0.881, Q2 = 0.584); (d) validation plot in ESI− mode.
Metabolic profiles of primary EOC patients vs. recurrent EOC patients, and post-operative EOC patients vs. recurrent EOC patients
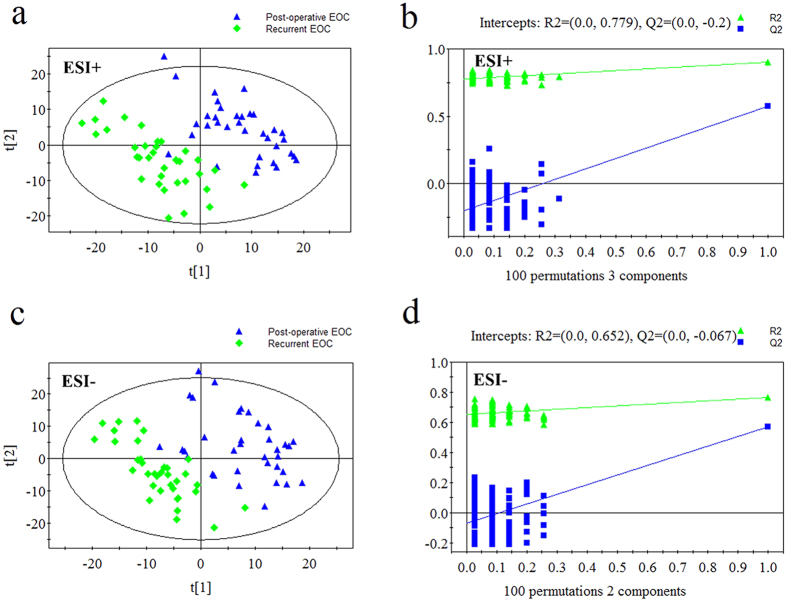
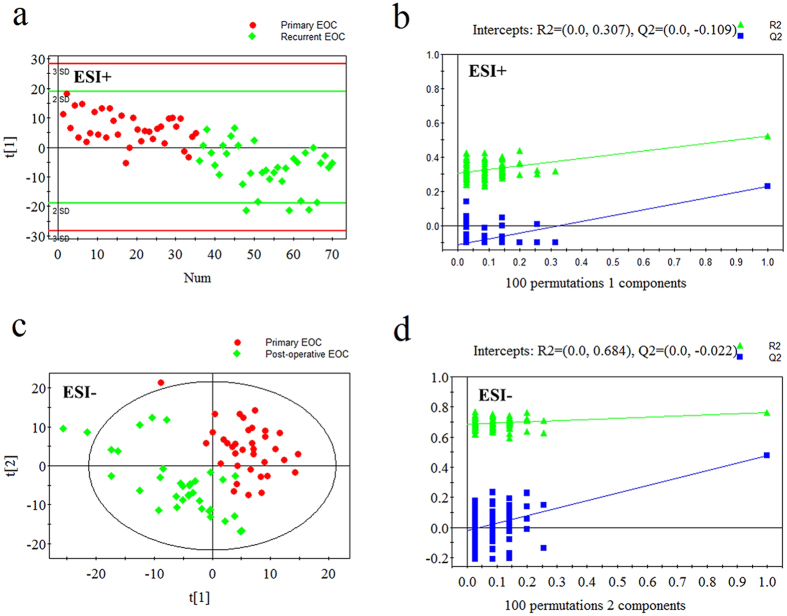
The PLS-DA score plots also showed differences between post-operative EOC patients and recurrent EOC patients, and between primary and recurrent EOC patients (Figs 3 and 4). Using the same criteria of VIP >1 and P < 0.05, 42 differential metabolites between post-operative and recurrent EOC patients and 26 between primary and recurrent EOC patients were selected. Compared with post-operative EOC patients, recurrent EOC patients showed increased LPCs, lysophosphatidylethanolamines (LPEs) and amino acids, and decreased 2-octenoic acid and creatine (see Supplementary Table S3). Compared with primary EOC patients, the levels of a series of lipids, amino acids and their related metabolites were remarkably increased in recurrent EOC patients (see Supplementary Table S4).
Figure 3. PLS-DA score plots and validation plots for post-operative EOC patients versus recurrent EOC patients.
(a) PLS-DA score plot in ESI+ mode (three components, R2 = 0.899, Q2 = 0.575); (b) validation plot in ESI+ mode; (c) PLS-DA score plot in ESI− mode (two components, R2 = 0.765, Q2 = 0.572); (d) validation plot in ESI− mode.
Figure 4. PLS-DA score plots and validation plots for primary EOC patients versus recurrent EOC patients.
(a) PLS-DA score plot in ESI+ mode (one component, R2 = 0.522, Q2 = 0.230); (b) validation plot in ESI+ mode; (c) PLS-DA score plot in ESI− mode (two components, R2 = 0.764, Q2 = 0.475); (d) validation plot in ESI− mode.
Dynamic changes of 37 primary EOC biomarkers across advanced EOC, surgery and recurrence
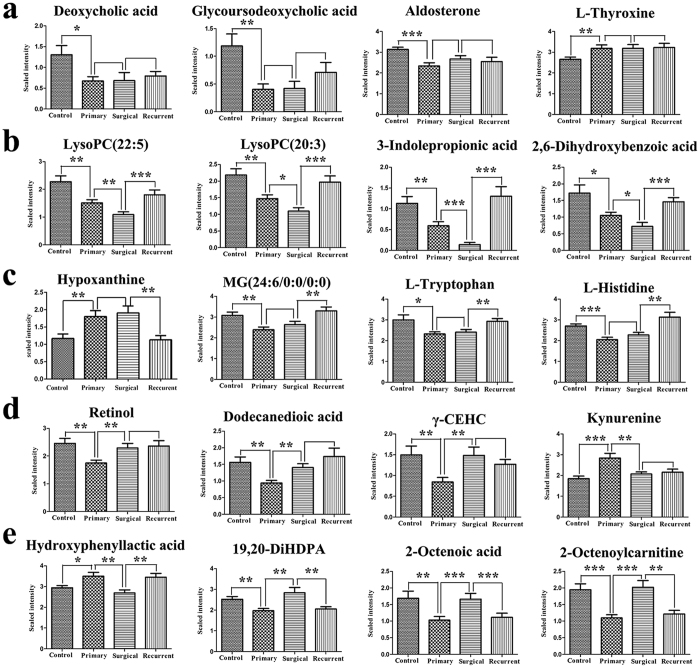
Metabolite levels of 37 primary EOC biomarkers were investigated further in the post-operative EOC patients and recurrent EOC patients. Multiple patterns of change in the levels of these biomarkers were observed. Some metabolites, including aldosterone and deoxycholic acid, remained unchanged in the groups of primary, post-operative and recurrent EOC patients (Fig. 5a). Some metabolites (e.g. LPC(22:5) and 3-indolepropionic acid) showed the same directional trends in both primary and post-operative EOC patients, but tended to recover towards levels of the control group in the recurrent EOC patients (Fig. 5b). Some metabolites, such as l-tryptophan and L-histidine, were unchanged from pre- to post-operative but changed from post-operative to recurrent EOC patients (Fig. 5c). Most remarkably, eight metabolites in the post-operative EOC patients, including l-kynurenine, γ-CEHC, 2-octenoylcarnitine, retinol, 2-octenoic acid, dodecanedioic acid, 19,20-DiHDPA and hydroxyphenyllactic acid, showed recovery towards levels of the control group (Fig. 5d). The levels of four of these metabolites (2-octenoylcarnitine, 2-octenoic acid, 19,20-DiHDPA and hydroxyphenyllactic acid) went back again to primary EOC levels in recurrent EOC patients (Fig. 5e). Among the metabolites discussed, these eight metabolites show the most potential for monitoring surgical efficacy and/or disease relapse. These changes for all metabolites are detailed in Supplementary Table S5.
Figure 5. Error bar chart (Mean + Standard error) for demonstrating dynamic changes of primary EOC biomarkers across advanced EOC, surgery and recurrence (*P < 0.05, **P < 0.01, ***P < 0.001, P values bigger than 0.05 are not marked).
Discussion
We investigated specific metabolic signatures for advanced EOC at diagnosis, surgery and relapse. Potential biomarkers were identified for primary, post-operative and recurrent EOC patients. Some metabolites exhibited excellent potential for monitoring EOC patients.
Recent studies have demonstrated that plasma metabolic profiles in women are age and menopause dependent17,18,19. Consequently, it is crucial to control these two factors in metabolomic studies to avoid false discoveries. In this study, these two factors were well controlled to allow for identification of specific biomarkers related to EOC. In line with previous reports of metabolomic studies on ovarian cancer, primary EOC patients exhibited altered metabolism of phospholipids, l-tryptophan and l-histidine, and piperidine derivatives12,13. Identification of some novel metabolite markers in this study probably resulted from the use of a different research design and improved capacity of metabolite identification compared with earlier studies. Compared with controls, significantly lower concentrations of tetracosahexaenoic acid, 2-octenoic acid, 12,13-DiHODE and 19,20-DiHDPA were observed in primary EOC patients. Knowledge of changes in these lipid-related metabolites supplements earlier understanding of lipid metabolism in EOC and further supports the finding that lipid metabolism is significantly disturbed in EOC20. It has been suggested that changes in lipid metabolism can affect numerous cellular processes, including cell growth, proliferation, differentiation and motility, which in turn contributes to tumourigenesis and malignancy21. p-Salicylic acid, a metabolite involved in ubiquinone biosynthesis, decreased in primary EOC patients. This could be an indication of energy disorders commonly seen in EOC, as ubiquinone is known to play an important role in mitochondrial respiratory and energy production22. Energy disorders are also indicated by the elevated hypoxanthine in primary EOC patients, as hypoxanthine is a potential generator of oxygen radicals and sensitive indicator of hypoxia23.
Therapeutic surgery for EOC aims to remove as much of the tumor as possible24. Metabolic changes between pre- and post-operative EOC patients could be attributed to oxidative stress, nutritional supplementation, or surgical curative effect25. Down-regulations of 3-indolepropionic acid and indoxylsulfuric acid might be indicative of altered oxidative stress in post-operative EOC patients, as both these metabolites have been suggested to be involved in oxidative stress26,27. This is further supported by the decreased uric acid levels seen in post-operative EOC patients, because uric acid has an important role as an oxidative stress marker28. Many significantly elevated metabolites in the post-operative EOC patients (e.g. capric acid, caprylic acid, and α-linolenic acid) may be attributable to nutritional supplementation (e.g. fat emulsion for intravenous injection during surgery), which is routinely performed to improve clinical outcome in major abdominal surgery29. Remarkably, we observed that the plasma levels of eight metabolites in the post-operative EOC patients trended towards recovering to the levels of the controls. This recovery is probably in response to the tumor removal. Therefore, these eight metabolites show great potential for monitoring EOC surgical efficacy.
Recurrent EOC patients are usually characterized by one of the biggest mysteries in cancer research, chemotherapy resistance, which accounts for most therapeutic failures and eventual death30. Compared with primary EOC patients, relapsed EOC patients showed substantial metabolic alterations. A series of amino acids (e.g. l-histidine, l-tryptophan, and l-phenylalanine) and amino acid-related metabolites (kynurenine, 2,3-dihydroxyvaleric acid, glyceric acid, and α-ketoisovaleric acid) were remarkably increased in relapsed EOC patients compared with the primary EOC patients. Further significant alterations in recurrent EOC patients were observed within lipid metabolism, as indicated by significantly increased levels of LPCs, LPEs and fatty acids. Altered pathways of amino acids and lipids have been suggested to contribute to platinum resistance in ovarian cancer cells31. Recent studies have also suggested that adverse lipid profile raises prostate cancer recurrence risk32. Therefore, alterations of these metabolites might serve as specific biomarkers for EOC recurrence and possibly as metabolism-based drug targets. Notably, the enhanced conversion of l-tryptophan to l-kynurenine by indoleamine-pyrrole 2,3-dioxygenase (IDO) has been well characterized in ovarian cancer33,34, and was evident in this study as well. Multiple clinical trials are currently evaluating IDO inhibitors for cancer immunotherapy34. Nevertheless, this reaction does not appear to be important in recurrent EOC patients, because l-kynurenine did not recover towards primary EOC levels in recurrent EOC patients. Therefore, our findings suggest that while IDO inhibitors may be promising for first-line therapy, they may not be applicable to resistant ovarian cancer.
Importantly, the levels of 2-octenoylcarnitine, 2-octenoic acid, 19,20-DiHDPA and hydroxyphenyllactic acid in the post-operative EOC patients trended towards recovering to levels of the control group but then trended towards primary EOC levels after disease relapse. As discussed above, recovery of these metabolites in the post-operative EOC patients could be attributed to surgical efficacy. Their recurrence in relapsed EOC patients is most likely caused by resurgent tumor proliferation. These four biomarkers are excellent potential biomarkers for monitoring EOC progression.
To the best of our knowledge, this study is the first to examine plasma metabolic changes in response to EOC surgery and recurrence. However, there were several limitations. One is the relatively small sample size in each group, which might prevent the differences in some metabolites from being fully apparent. In addition, a targeted and quantitative analysis of the potential biomarkers is needed to advance clinical translation. For future research, we are collecting a larger sample cohort and performing a targeted metabolomic investigation into these biomarkers.
In summary, we present a holistic view of the plasma metabolic changes related to advanced EOC at diagnosis, surgery and relapse. Specific metabolite markers have been identified that could be used to monitor surgery efficacy and disease relapse. Primary EOC is characterized by abnormal lipid metabolism, energy disorders and altered l-tryptophan metabolism. The phenomena of oxidative stress and surgical efficacy are clear in the metabolic profiles of post-operative EOC patients. Metabolic signatures in recurrent EOC patients show increased amino acid and lipid metabolism compared with primary EOC patients. In all, this study highlights a number of potential EOC biomarkers that could facilitate both understanding and monitoring of advanced EOC, its remission and progression.
Methods
Plasma samples
The present experiments were conducted in accordance with the 1975 Declaration of Helsinki. The protocol in this study was approved by the Ethics Committee of the Tumor Hospital at Harbin Medical University, Harbin, China. Plasma samples were collected by the Department of Gynecology of the Tumor Hospital at Harbin Medical University between January 2012 and July 2013. All the participants gave informed written consent. The inclusion criteria and exclusion criteria were as follows: (1) participants suffering from metabolic, liver, or kidney diseases or any other cancers were excluded; (2) controls were defined as uterine fibroid patients or benign ovarian tumor patients; (3) primary EOC patients and controls were not taking any medications, and their diagnosis was confirmed by histopathology after surgery; (4) blood samples from post-operative EOC patients were collected within 3–7 days of cytoreductive surgery; (5) recurrent EOC patients were confirmed by follow-up blood tests, physical examinations, and imaging tests. After fasting for 12 h, 5 mL of whole blood was collected from each patient into an EDTA tube. Fresh blood was centrifuged at 1,000 ×g for 10 min, and the supernatant was collected and frozen at −80 °C until analysis.
Quality control (QC) samples
To ensure the stability and repeatability of the RRLC/MS systems, QC samples were used in both electrospray ionization positive (ESI+) and negative (ESI−) modes. Pooled QC samples were prepared from a mixture of all plasma samples. One QC sample was run after every twelve samples.
Sample pretreatment
In order to ensure a balance in sample size across groups over time, sample pretreatment and RRLC/MS analysis were performed using the blocked randomization method35. The block size was set at 4, so there are 24 possible ways to equally assign samples to a block. Allocation proceeds by randomly selecting one of the orderings and assigning the samples according to the specified sequence. After the plasma samples were thawed in a 4 °C refrigerator, 200 μL of plasma was mixed with five times the volume (1000 μL) of acetonitrile at 4 °C. The samples were centrifuged at 4,000 ×g for 10 min at 4 °C. The supernatant was transferred into a clean vial, and evaporated until dry, under reduced pressure. The residue was dissolved in 100 μLof acetonitrile/water (3:1, v/v), vortex-mixed for 1 min, and then centrifuged at 12,000 ×g for 15 min at 4 °C. The supernatant was then placed into the sample vial for analysis.
Chromatography
A 10 μL aliquot of the pre-treated sample was injected into a 3.0 × 100 mm (1.8 mm) ZORBAX SB-C18 column (Agilent Technologies, Santa Clara, CA, USA) for RRLC (1260 series; Agilent Technologies). The mobile phase for ESI+ was a mixture of acetonitrile containing 0.1% formic acid (A) and water containing 0.1% formic acid (B). The mobile phase for ESI− was a mixture of acetonitrile (A) and water (B). A linear mobile phase gradient was used as follows: 2% A, held for 1 min; 1–18 min, increased to 98% A; 18–21 min, held at 98% A; 21–21.1 min, decreased to 2%A; and 21.1–28 min, held at 2% A. The mobile phase flow rate was 0.3 mL/min at 40 °C.
Mass spectrometry
Mass spectrometry was performed with an Agilent 6530-QTOF (Agilent Technologies) operating in both ESI+ and ESI− modes. The capillary voltage was set as 4.0 kV for ESI+ mode and 3.5 kV for ESI− mode. Nitrogen was used as the desolvation gas at a flow rate of 10 L/min. The desolvation temperature was 350 °C. Centroid data were collected in full scan mode from 50 to 1000 m/z.
Data preprocessing and annotation
The XCMS package was used to preprocess the raw data in the R platform, including peak detection, peak matching, matched filtration, and retention time alignment36. The default XCMS parameters were used, with the following exceptions: xcmsSet (method = “centWave”, peakwidth = c(10,60)); group (bw = 20, minfrac = 0.6); retcor (method = “obiwarp”). The preprocessed results generated a data matrix that consisted of the retention times, mass-to-charge ratio (m/z) values, and peak intensities. CAMERA in R was then used to annotate isotope peaks, adducts and fragments in the peak lists37. Isotopic peaks were excluded before statistical analysis.
Statistical analysis
The preprocessed data was exported to SIMCA-P 11.5 software for multivariate analysis. Principal component analysis (PCA) was first used to detect separation trends and outliers38. Partial least-squares discriminant analysis (PLS-DA) was then performed to understand global metabolic changes between groups. To avoid overfitting, permutation tests with 100 iterations were performed to validate the supervised model39. Variable importance in the projection (VIP) for each metabolite was calculated based on the established PLS-DA model. In addition, Welch’s t-test was used to further validate the significance of each metabolite. Potential metabolic biomarkers were selected using VIP > 1 and P < 0.05. To visualize metabolite changes across advanced EOC, surgery and recurrence, the standardized metabolite level in the four groups was plotted in an error bar chart.
Additional Information
How to cite this article: Ke, C. et al. Metabolic phenotyping for monitoring ovarian cancer patients. Sci. Rep. 6, 23334; doi: 10.1038/srep23334 (2016).
Supplementary Material
Acknowledgments
This work was funded by National Natural Science Foundation of China (project number 81473072, 81472028).
Footnotes
Author Contributions K.L., G.L. and C.K. conceived and designed the research; C.K. and A.L. wrote the manuscript; M.S., J.W., F.Z. and Y.W. performed the experiments; J.C. and J.L. collected the plasma samples; K.Y., T.G. and Q.L. contributed to metabolite identification and biological interpretation; A.L. and Y.H. analyzed the experimental data.
References
- Rauh-Hain J. A., Krivak T. C., Del Carmen M. G. & Olawaiye A. B. Ovarian cancer screening and early detection in the general population. Rev Obstet Gynecol 4, 15–21 (2011). [PMC free article] [PubMed] [Google Scholar]
- Hennessy B. T., Coleman R. L. & Markman M. Ovarian cancer. Lancet 374, 1371–1382 (2009). [DOI] [PubMed] [Google Scholar]
- Kim A., Ueda Y., Naka T. & Enomoto T. Therapeutic strategies in epithelial ovarian cancer. J Exp Clin Cancer Res 31, 14 (2012). [DOI] [PMC free article] [PubMed] [Google Scholar]
- Chien J., Kuang R., Landen C. & Shridhar V. Platinum-sensitive recurrence in ovarian cancer: the role of tumor microenvironment. Frontiers in oncology 3, 251 (2013). [DOI] [PMC free article] [PubMed] [Google Scholar]
- Benjamin D. I., Cravatt B. F. & Nomura D. K. Global profiling strategies for mapping dysregulated metabolic pathways in cancer. Cell Metab 16, 565–577 (2012). [DOI] [PMC free article] [PubMed] [Google Scholar]
- Nicholson J. K. & Lindon J. C. Systems biology: Metabonomics. Nature 455, 1054–1056 (2008). [DOI] [PubMed] [Google Scholar]
- Chen J. et al. Serum 27-nor-5beta-cholestane-3,7,12,24,25 pentol glucuronide discovered by metabolomics as potential diagnostic biomarker for epithelium ovarian cancer. J Proteome Res 10, 2625–2632 (2011). [DOI] [PubMed] [Google Scholar]
- Ben Sellem D. et al. Metabolomic Characterization of Ovarian Epithelial Carcinomas by HRMAS-NMR Spectroscopy. J Oncol 2011, 174019 (2011). [DOI] [PMC free article] [PubMed] [Google Scholar]
- Fong M. Y., McDunn J. & Kakar S. S. Identification of metabolites in the normal ovary and their transformation in primary and metastatic ovarian cancer. PloS one 6, e19963 (2011). [DOI] [PMC free article] [PubMed] [Google Scholar]
- Zhang T. et al. Discrimination between malignant and benign ovarian tumors by plasma metabolomic profiling using ultra performance liquid chromatography/mass spectrometry. Clin Chim Acta 413, 861–868 (2012). [DOI] [PubMed] [Google Scholar]
- Fan L. et al. Identification of metabolic biomarkers to diagnose epithelial ovarian cancer using a UPLC/QTOF/MS platform. Acta oncologica 51, 473–479 (2012). [DOI] [PubMed] [Google Scholar]
- Zhang T. et al. Identification of potential biomarkers for ovarian cancer by urinary metabolomic profiling. J Proteome Res 12, 505–512 (2013). [DOI] [PubMed] [Google Scholar]
- Ke C. et al. Large-scale profiling of metabolic dysregulation in ovarian cancer. International journal of cancer. Journal international du cancer 136, 516–526 (2015). [DOI] [PubMed] [Google Scholar]
- Zhang H. et al. Prediction of advanced ovarian cancer recurrence by plasma metabolic profiling. Mol Biosyst 11, 516–521 (2015). [DOI] [PubMed] [Google Scholar]
- Vorkas P. A. et al. Untargeted UPLC-MS profiling pipeline to expand tissue metabolome coverage: application to cardiovascular disease. Anal Chem 87, 4184–4193 (2015). [DOI] [PMC free article] [PubMed] [Google Scholar]
- Sun M. et al. Identification of biomarkers for unstable angina by plasma metabolomic profiling. Mol Biosyst 9, 3059–3067 (2013). [DOI] [PubMed] [Google Scholar]
- Yu Z. et al. Human serum metabolic profiles are age dependent. Aging Cell 11, 960–967 (2012). [DOI] [PMC free article] [PubMed] [Google Scholar]
- Auro K. et al. A metabolic view on menopause and ageing. Nat Commun 5, 4708 (2014). [DOI] [PubMed] [Google Scholar]
- Ke C. et al. Plasma Metabolic Profiles in Women are Menopause Dependent. PloS one 10, e0141743 (2015). [DOI] [PMC free article] [PubMed] [Google Scholar]
- Tania M., Khan M. A. & Song Y. Association of lipid metabolism with ovarian cancer. Current oncology 17, 6–11 (2010). [DOI] [PMC free article] [PubMed] [Google Scholar]
- Santos C. R. & Schulze A. Lipid metabolism in cancer. FEBS J 279, 2610–2623 (2012). [DOI] [PubMed] [Google Scholar]
- Lenaz G. & Genova M. L. Mobility and function of coenzyme Q (ubiquinone) in the mitochondrial respiratory chain. Biochim Biophys Acta 1787, 563–573 (2009). [DOI] [PubMed] [Google Scholar]
- Saugstad O. D. Hypoxanthine as an indicator of hypoxia: its role in health and disease through free radical production. Pediatr Res 23, 143–150 (1988). [DOI] [PubMed] [Google Scholar]
- Vergote I. et al. Neoadjuvant chemotherapy or primary surgery in stage IIIC or IV ovarian cancer. N Engl J Med 363, 943–953 (2010). [DOI] [PubMed] [Google Scholar]
- Qiu Y. et al. Urinary metabonomic study on colorectal cancer. J Proteome Res 9, 1627–1634 (2010). [DOI] [PubMed] [Google Scholar]
- Hwang I. K. et al. Indole-3-propionic acid attenuates neuronal damage and oxidative stress in the ischemic hippocampus. J Neurosci Res 87, 2126–2137 (2009). [DOI] [PubMed] [Google Scholar]
- Muteliefu G., Enomoto A., Jiang P., Takahashi M. & Niwa T. Indoxyl sulphate induces oxidative stress and the expression of osteoblast-specific proteins in vascular smooth muscle cells. Nephrol Dial Transplant 24, 2051–2058 (2009). [DOI] [PubMed] [Google Scholar]
- Glantzounis G. K., Tsimoyiannis E. C., Kappas A. M. & Galaris D. A. Uric acid and oxidative stress. Curr Pharm Des 11, 4145–4151 (2005). [DOI] [PubMed] [Google Scholar]
- Cerantola Y. et al. Perioperative nutrition in abdominal surgery: recommendations and reality. Gastroenterol Res Pract 2011, 739347 (2011). [DOI] [PMC free article] [PubMed] [Google Scholar]
- Borst P. Cancer drug pan-resistance: pumps, cancer stem cells, quiescence, epithelial to mesenchymal transition, blocked cell death pathways, persisters or what? Open Biol 2, 120066 (2012). [DOI] [PMC free article] [PubMed] [Google Scholar]
- Poisson L. M. et al. A metabolomic approach to identifying platinum resistance in ovarian cancer. Journal of ovarian research 8, 13 (2015). [DOI] [PMC free article] [PubMed] [Google Scholar]
- Allott E. H. et al. Serum lipid profile and risk of prostate cancer recurrence: Results from the SEARCH database. Cancer epidemiology, biomarkers & prevention: a publication of the American Association for Cancer Research, cosponsored by the American Society of Preventive Oncology 23, 2349–2356 (2014). [DOI] [PMC free article] [PubMed] [Google Scholar]
- Platten M., Wick W. & Van den Eynde B. J. Tryptophan catabolism in cancer: beyond IDO and tryptophan depletion. Cancer research 72, 5435–5440 (2012). [DOI] [PubMed] [Google Scholar]
- Godin-Ethier J., Hanafi L. A., Piccirillo C. A. & Lapointe R. Indoleamine 2,3-dioxygenase expression in human cancers: clinical and immunologic perspectives. Clinical cancer research: an official journal of the American Association for Cancer Research 17, 6985–6991 (2011). [DOI] [PubMed] [Google Scholar]
- Suresh K. An overview of randomization techniques: An unbiased assessment of outcome in clinical research. J Hum Reprod Sci 4, 8–11 (2011). [DOI] [PMC free article] [PubMed] [Google Scholar] [Retracted]
- Smith C. A., Want E. J., O’Maille G., Abagyan R. & Siuzdak G. XCMS: processing mass spectrometry data for metabolite profiling using nonlinear peak alignment, matching, and identification. Anal Chem 78, 779–787 (2006). [DOI] [PubMed] [Google Scholar]
- Kuhl C., Tautenhahn R., Bottcher C., Larson T. R. & Neumann S. CAMERA: an integrated strategy for compound spectra extraction and annotation of liquid chromatography/mass spectrometry data sets. Anal Chem 84, 283–289 (2012). [DOI] [PMC free article] [PubMed] [Google Scholar]
- Trygg J., Holmes E. & Lundstedt T. Chemometrics in metabonomics. J Proteome Res 6, 469–479 (2007). [DOI] [PubMed] [Google Scholar]
- Westerhuis J. A. et al. Assessment of PLSDA cross validation. Metabolomics 4, 81–89 (2008). [Google Scholar]
Associated Data
This section collects any data citations, data availability statements, or supplementary materials included in this article.


