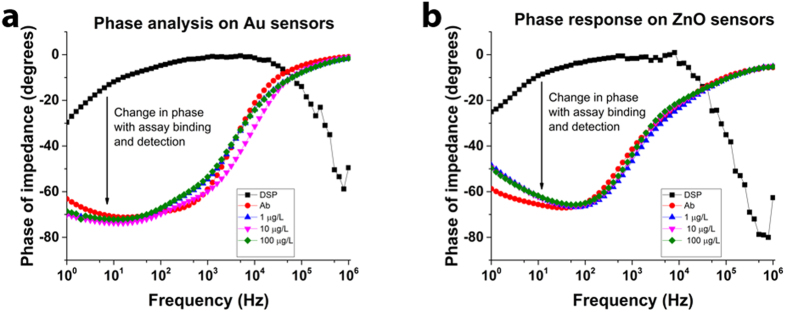
Figure 3.
Impedance phase spectra to identify electrical nature of binding on the Au and ZnO sensor electrodes (a) Phase plot on Au sensors and (b) ZnO sensors after antibody immobilization and EtG detection. Data from this plot was collected from n = 3 replicates and fitted to the equivalent circuit model for identification of impedance dominating component.

