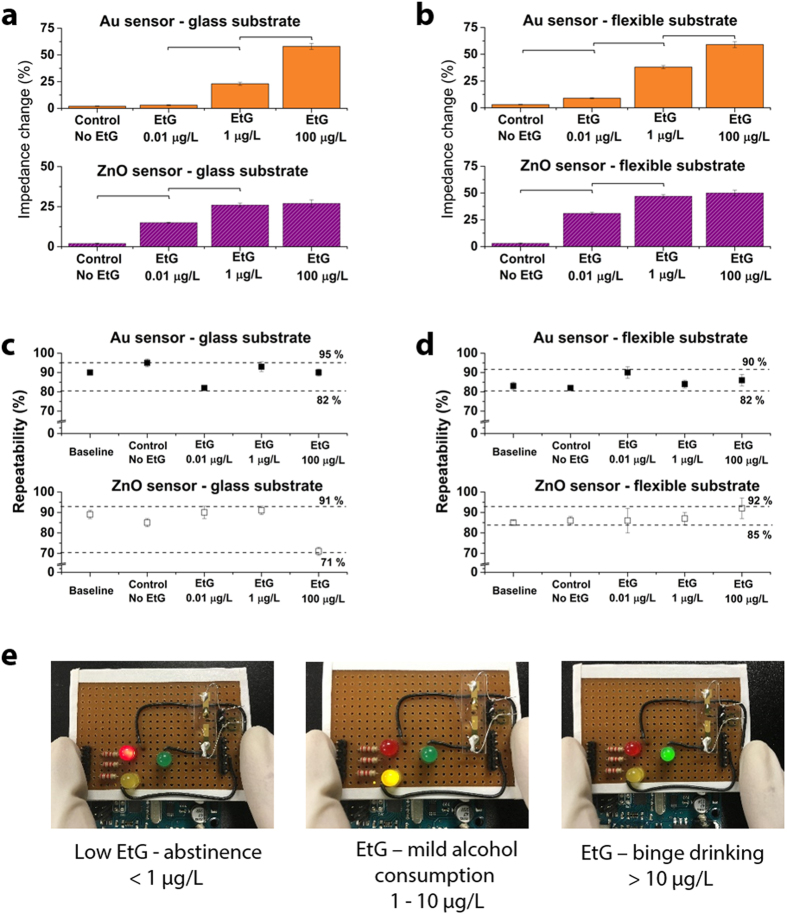
Figure 6. Evaluation of sensor performance and optical LED readout for user communication.
(a,b) Sensor response to blind samples of EtG tested on Au and ZnO sensors. (c,d) Demonstrate repeatability of the system for the Au and ZnO sensors. (e) Smart optical LED readout display for classifying alcohol consumption behavior. Statistical significance threshold was set at 0.05 (p < 0.05). Error bars represent standard error of the mean form n = 3 replicates.

