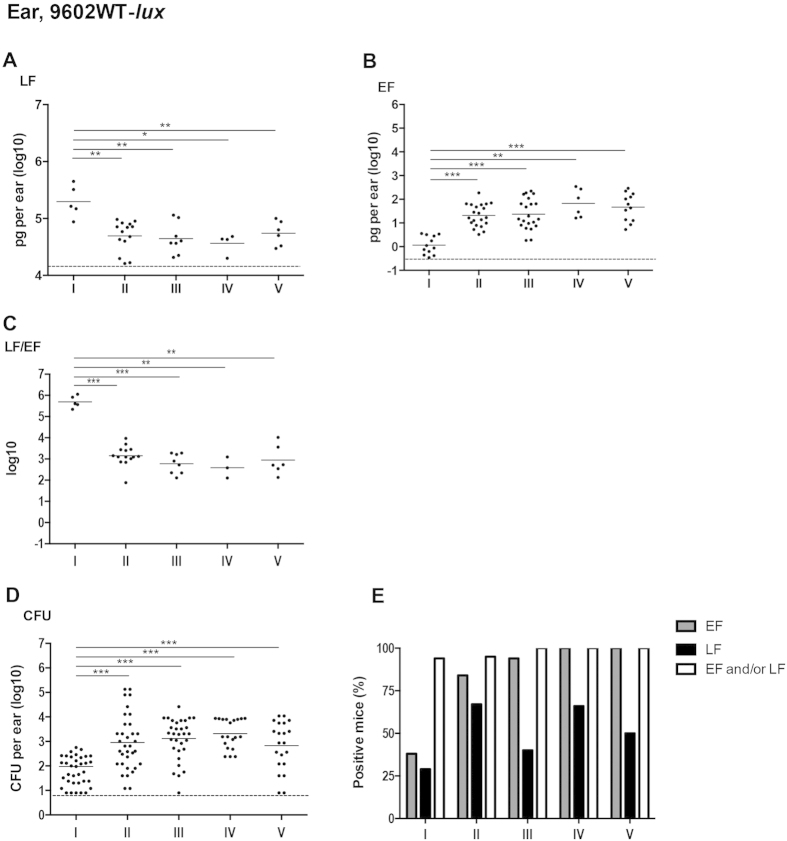
Figure 2. In vivo dynamics of LF and EF production at the initial site of infection with the wild type encapsulated toxinogenic 9602-lux B. anthracis strain.
Active lethal factor (LF, A) and edema factor (EF, B) and bacterial load (CFU, D) were quantified in the inoculated ear cutaneous tissue as described in the section Materiel and Methods, for each stage of infection with the wild type B. anthracis 9602-lux (9602WT-lux) strain as defined in Fig. 1 and in the Results section. The LF/EF ratio (C) was calculated from the LF and EF values obtained for each individual mouse. (E) Percentages of mice for which the EF or LF value was above the detection threshold (see Table 1, the Materials and Methods and the Results sections); also shown is the combined percentage of mice for which the LF and/or EF values were positive; all mice were positive for B. anthracis. Threshold values are represented as dotted lines (0.9 log10 for CFU, 16 ng/ear of homogenized ear and 0.34 pg/ear of homogenized ear for LF and EF respectively; see Results section). Results are expressed as pg per total cutaneous ear tissue (pg/ml of homogenized ear); each dot represents an individual mouse and the bar represents the mean for each mouse population at each infection stage. The asterisks denote statistically significant differences (Mann-Whitney test); *p < 0.05; **p < 0.01; ***p < 0.001.

