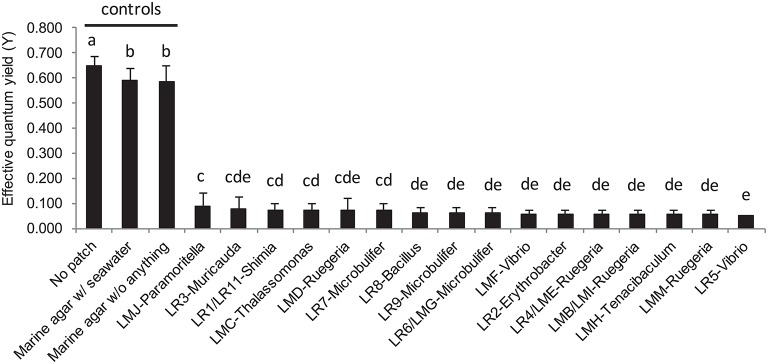
Figure 6.
Barplot representation of the photosynthetic efficiency from Acropora muricata measured by Pulse Amplitude Modulated (PAM) fluorometry following the in situ bioassays with mono-specific bacterial inclusion culture with the 16 strains isolated from L. rosacea and L. monticola. The statistical analyses, comparing the bacterial culture patches to control patches, were performed using one-way ANOVA and Tukey's HSD post-hoc test. Letters indicate distinct groupings based on post-hoc statistical comparison among sub-fractions. n = 10 assays. Error bars represent standard deviation of the mean.

