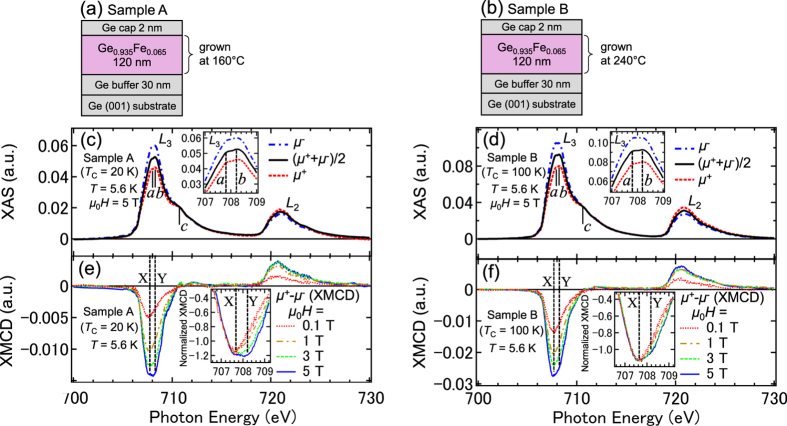
Figure 1. Sample structures, XAS spectra and XMCD spectra.
(a,b) Schematic structures of sample A (a) and sample B (b). (c,d) XAS spectra of μ−, μ+ and (μ+ + μ−)/2 at the L2 (~721 eV) and L3 (~708 eV) absorption edges of Fe for sample A (c) and sample B (d) measured at 5.6 K with μ0H = 5 T applied perpendicular to the film surface. The insets show a magnified plot of the spectra at the Fe L3 edge. (e,f) XMCD (=μ+ − μ−) spectra at the L2 and L3 absorption edges of Fe for sample A (e) and sample B (f) measured at 5.6 K with various H applied perpendicular to the film surface. The insets show a magnified plot of the spectra at the Fe L3 edge, in which the XMCD data are normalized to 707.3 eV.

