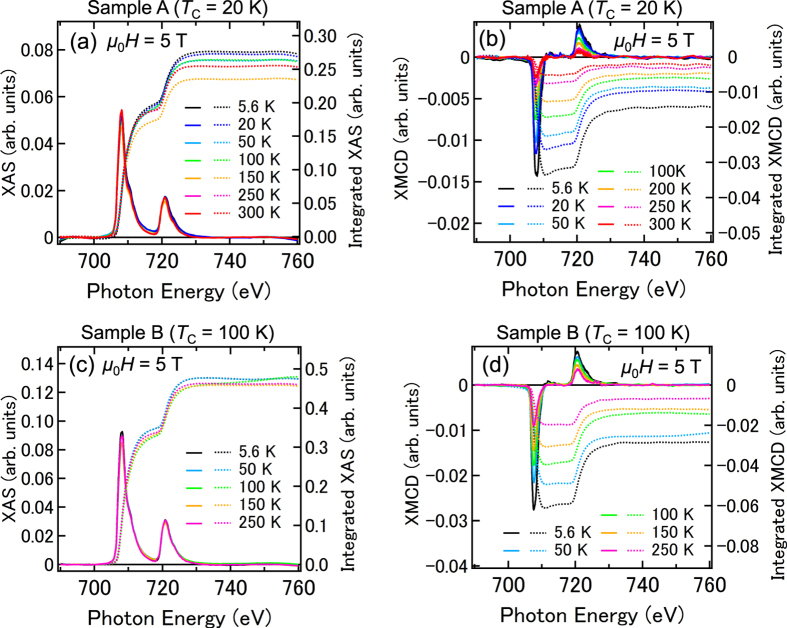
Figure 2. Integrated XAS and XMCD spectra.
(a,c) XAS [=(μ+ + μ−)/2] spectra (solid curves) and the XAS signals integrated from 690 eV (dashed curves) of sample A (a) and sample B (c). (b,d) XMCD (=μ+ − μ−) spectra (solid curves) and the XMCD signals integrated from 690 eV (dashed curves) of sample A (b) and sample B (d). These measurements were carried out with a magnetic field μ0H = 5 T applied perpendicular to the film surface at 5.6 K (black curves), 20 K (blue curves), 50 K (light blue curves), 100 K (green curves), 150 K (orange curves), 250 K (pink curves), and 300 K (red curves).

