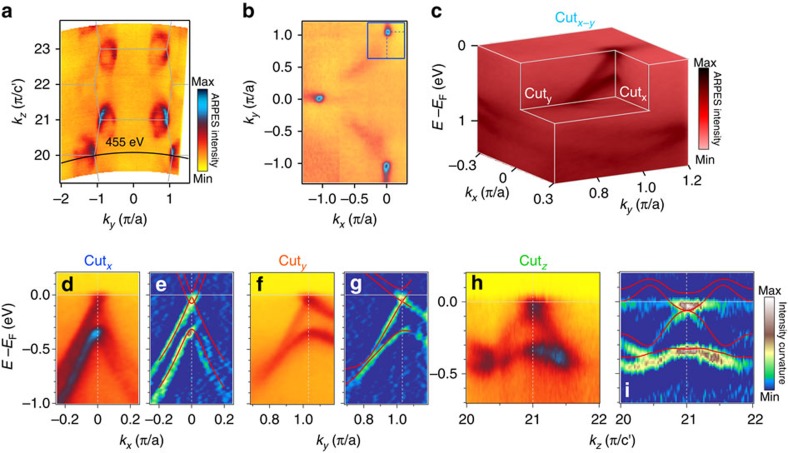
Figure 3. W2 type of Weyl cones in TaP.
(a) Fermi surface map in the ky-kz plane at kx=0, acquired with soft X-ray. (b) Fermi surface map in the kx-ky plane at kz=0, taken with hv=455 eV as indicated in a. (c) ARPES intensity profile as a function of energy relative to Fermi level in the kx-ky plane containing a pair of Weyl nodes W2. (d) Photoemission intensity plot along cutx passing through W2. (e) The corresponding curvature plot of the spectrum in d with the calculated bands overlaid on top for comparison. (f,g) and (h,i), Same as d,e but along a long cuty and cutz, respectively.

