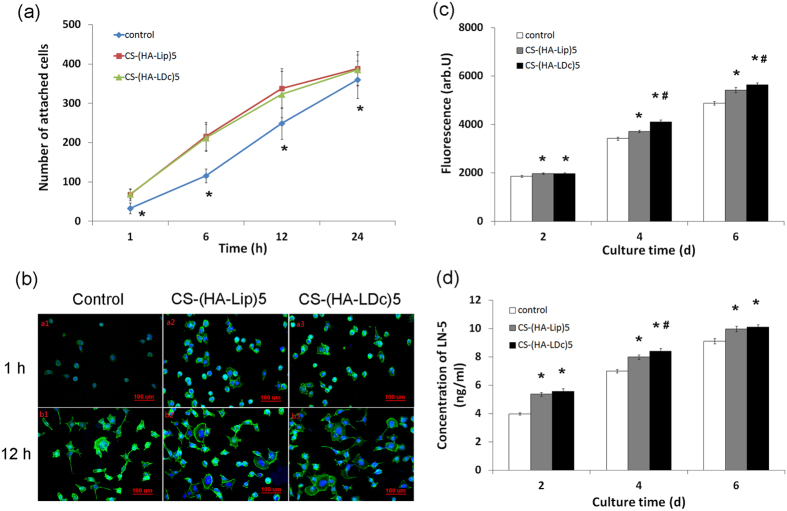
Figure 4. Biological evaluation of HEK293 cells on different surfaces.
(a) Cell adhesion assay of early stage. Number of HEK293 cells attached to substrata (control, CS-(HA-Lip)5, CS-(HA-LDc)5 after 1 h, 6 h, 12 h and 24 h of culture. Ten randomly chosen fields (1.2 mm2) per sample were evaluated. The values = means ± SD. Statistical analysis by ANOVA: *P < 0.05 versus CS-(HA-Lip)5 and CS-(HA-LDc)5 at the corresponding time point. (b) The fluorescence microscopic photo showing morphology of HEK293 cells cultured for 1 h and 12 h on control (a1, b1), CS-(HA-Lip)5 (a2, b2), CS-(HA-LDc)5 (a3, b3). (c) Cell proliferation and attachment on different groups were determined by fluorescence assay. *Statistically significant difference between the CS-(HA-Lip)5 or CS-(HA-LDc)5 group and the control group (P < 0.01); #Statistically significant difference between the CS-(HA-Lip)5 and CS-(HA-LDc)5 group (P < 0.01). The data shown are the mean fluorescence value ± SD (n = 3). (d) Quantification of Laminin-5 secretion in HEK293 cells culture on different surfaces. *Statistically significant difference between the CS-(HA-Lip)5 or CS-(HA-LDc)5 group and the control group (P < 0.01); #Statistically significant difference between the CS-(HA-Lip)5 and CS-(HA-LDc)5 group (P < 0.05). The data shown are the mean concentration value ± SD (n = 3).

