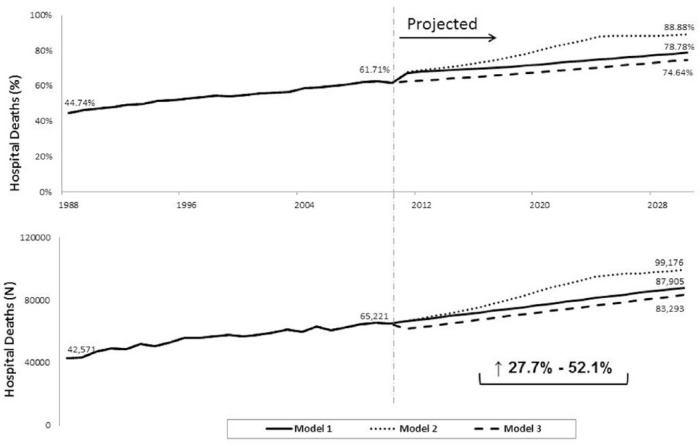
Figure 3.
Past trends and future projections of hospital deaths according to three models (Portugal, 1988–2030).
The mean of the last 5-year slopes (2006–2010) was used in all models. The slopes’ variable changed depending on the model: model 1 – slopes of absolute numbers of hospital deaths; model 2 – slopes of proportion of change of hospital deaths; and model 3 – slopes of proportions of non-hospital deaths.

