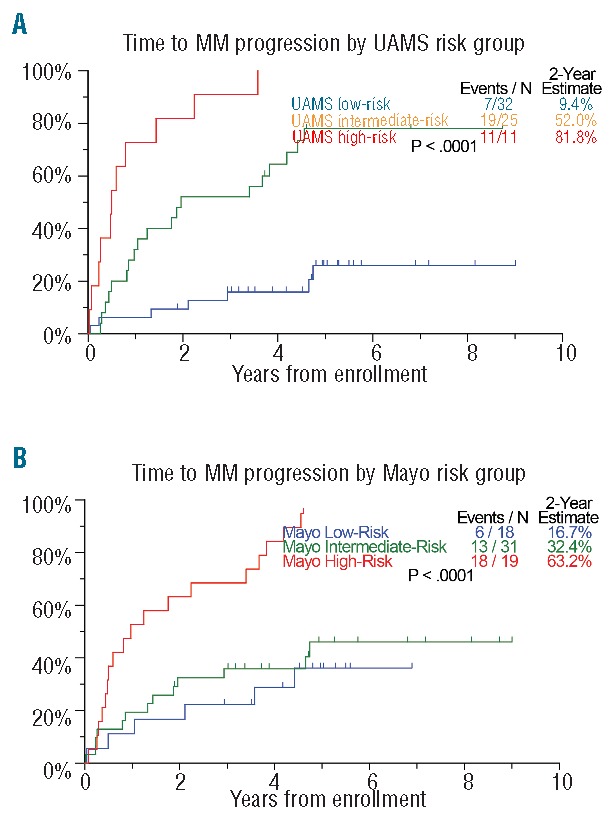
Figure 3.

TTT comparison on University of Arkansas for Medical Sciences (UAMS) and Mayo risk models. Patients with complete data for model comparison were classified and compared for TTT using (A) the classification scheme driven by the four-gene score and (B) the Mayo FLC-ratio >8 risk stratification model.
