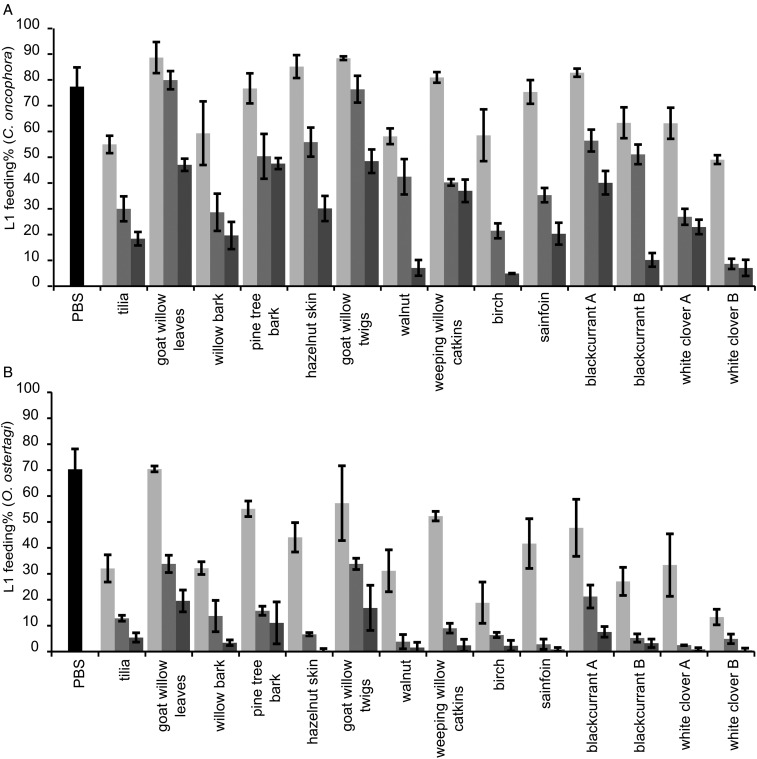
Fig. 2.
Results of the LFIA with 14 CT fractions on L1 of Cooperia oncophora (A) and Ostertagia ostertagi (B). Bars represent the mean percentage of fed larvae (%) from three replicates for each fractions at 2·5 (light grey), 10 (grey) and 40 (dark grey) μg of CT mL−1 and the pooled mean for the negative control (PBS) with error bars as s.d. The chemical structure of CT can be found in (Williams et al. 2014a).

