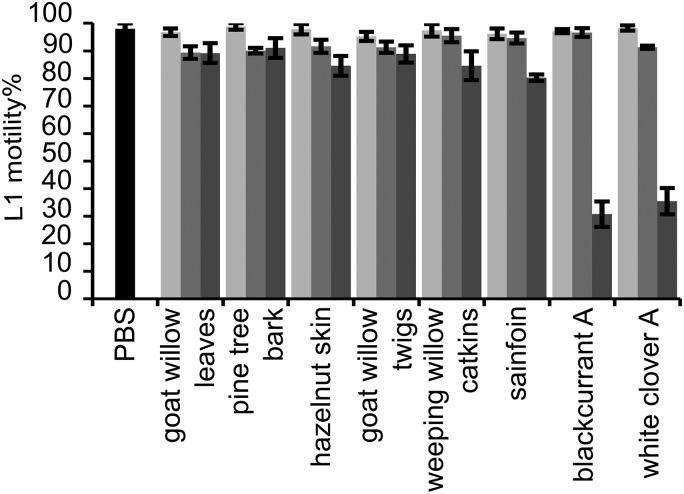
Fig. 4.
Motility of the first-stage larvae (L1) of Ostertagia ostertagi in the presence of eight different CT fractions. Experiment was performed at the same time as the larval feeding (see Fig. 2B). Any larval movement within 5 s was counted as motile. Bars represent either the pooled mean for the negative control (PBS) or the mean of the percentage of motile L1 incubated at 2·5 (light grey), 10 (grey) and 40 (dark grey) μg of CT mL−1 in triplicates with error bars as s.d.

