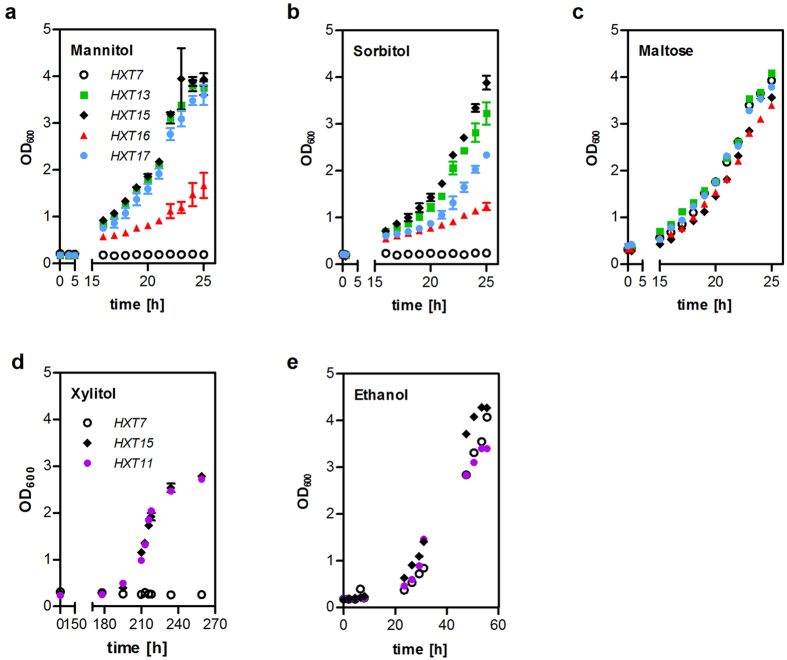
Figure 1. Growth of the hxt0 strains expressing individual transporters on polyols.
SC-media supplemented with 2% (w/v) of the indicated carbon source were inoculated in shake flasks with EBY.VW4000 (a–c) or AFY10 (d,e) cells expressing individual transporters together with the mannitol dehydrogenase YNR073C (a), sorbitol dehydrogenase SOR1 (b,c) or xylitol dehydrogenase XYL2 (d,e). Growth was monitored by measuring OD600 of the cultures. For growth on polyols (a,b,d), mean values and standard deviation of biological triplicates are shown. The controls (c,e) represent single measurements. Note that time-axes are truncated for clarity.

