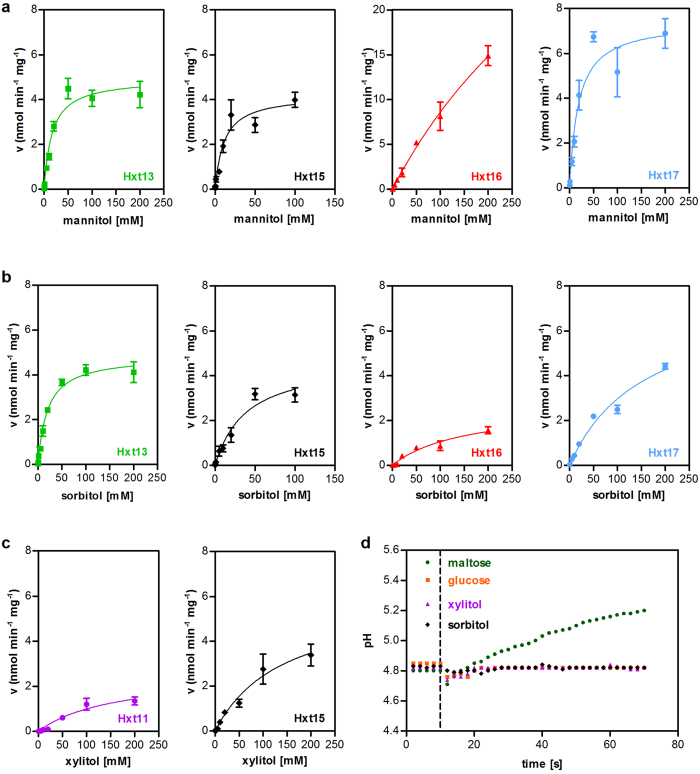
Figure 2. Uptake kinetics and transport mechanism.
Individual transporters were co-expressed with the mannitol dehydrogenase YNR073C (a), sorbitol dehydrogenase SOR1 (b) or xylitol dehydrogenase XYL2 (c) in EBY.VW4000 (a,b) or AFY10 (c). The uptake velocity v (expressed as nmol polyol transported per minute per mg cell dry weight) is plotted against substrate concentration. Mean values and standard deviation were calculated from biological triplicates. The lines represent a least-square fit to the Michaelis-Menten equation. (d) Hxt1, Hxt11 or Hxt15 were individually overexpressed in EBY.VW4000. The change of the pH value in an unbuffered suspension of cells after addition of glucose (Hxt1), xylitol (Hxt11) or sorbitol (Hxt15) was measured. Maltose symport in the EBY.VW4000 background was used as a positive control. Dashed line indicates the time point of carbohydrate addition.

